Fig. 3.
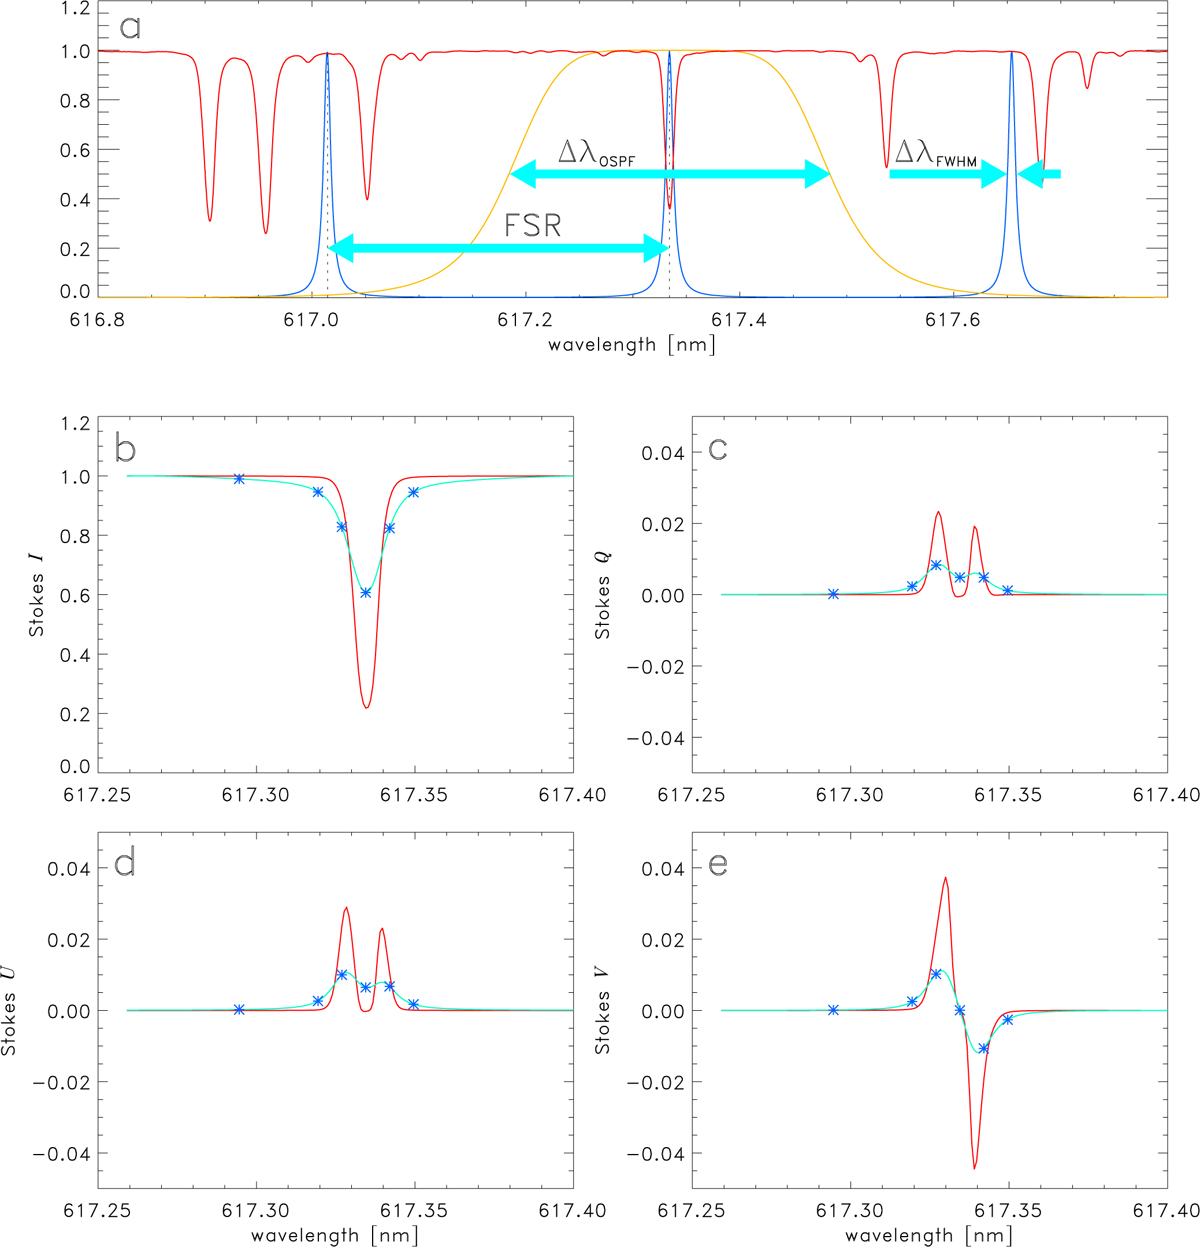
Measurement principle of SO/PHI. Panel a: solar spectrum around 617 nm (red; FTS atlas; see Neckel & Labs 1984), tunable filter profile (blue) and prefilter bandpass (yellow); FSR and ΔλFWHM denote the free spectral range and the full width at half maximum of the Filtergraph, ΔλOSPF is the full width of the order-sorting prefilter. Panels b–e: Fe I 6173 Å Stokes profiles obtained from one spatial point of an MHD simulation (red) and ideally simulated SO/PHI primary observables (light blue). The blue asterisks denote the expected SO/PHI measurements when tuning the filter pass-band to the dedicated wavelength positions.
Current usage metrics show cumulative count of Article Views (full-text article views including HTML views, PDF and ePub downloads, according to the available data) and Abstracts Views on Vision4Press platform.
Data correspond to usage on the plateform after 2015. The current usage metrics is available 48-96 hours after online publication and is updated daily on week days.
Initial download of the metrics may take a while.