Fig. 2.
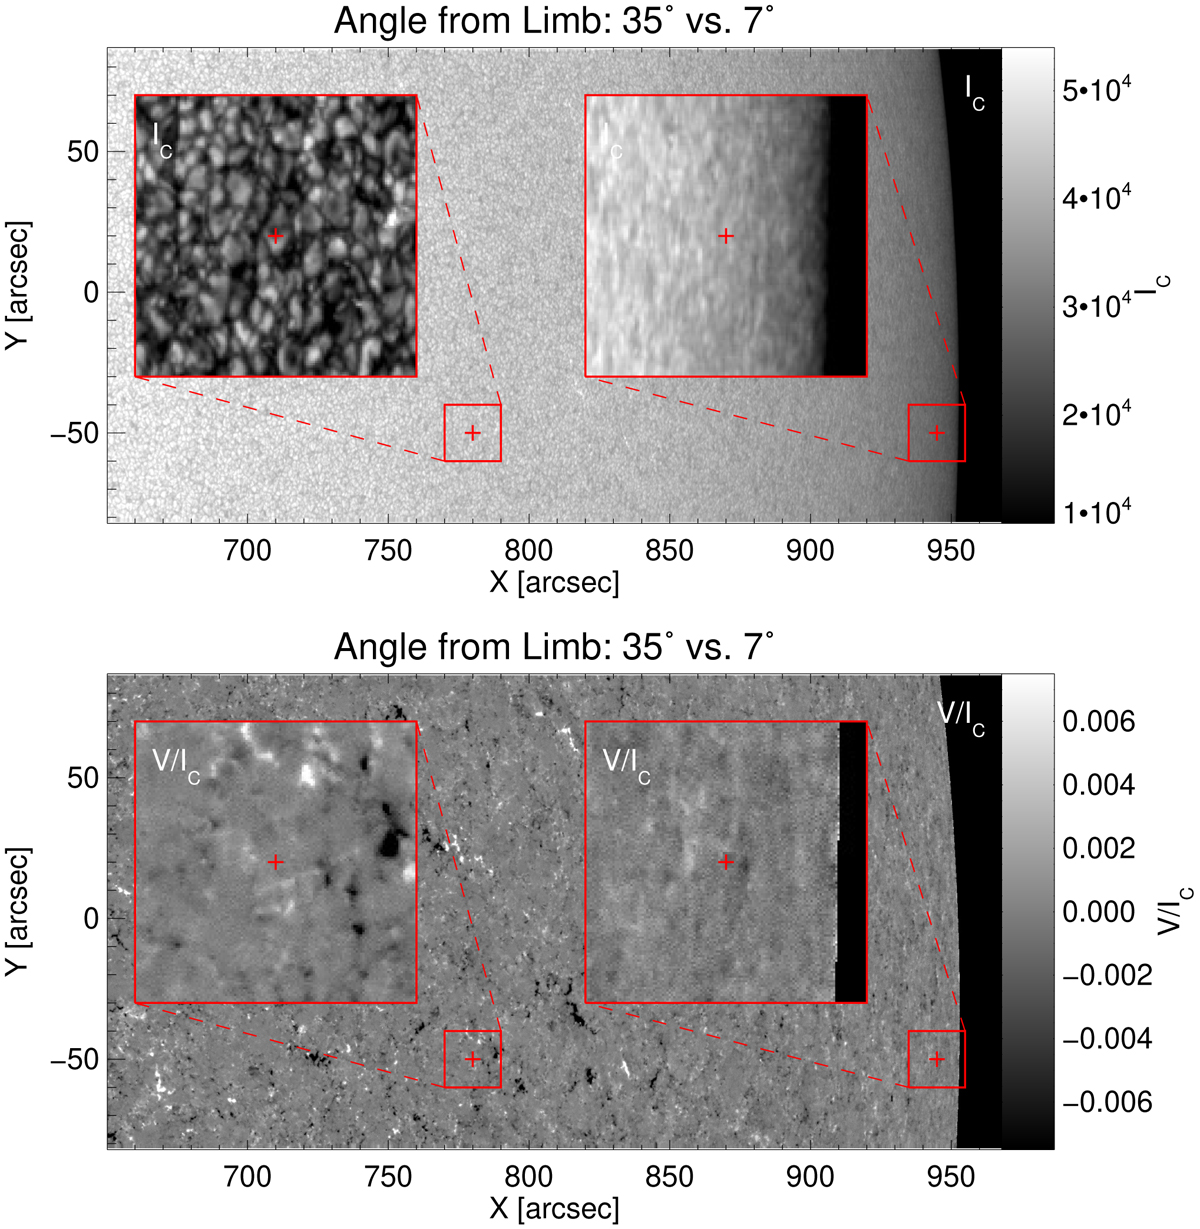
Continuum intensity map (upper panel) and Stokes V map (lower panel) of a quiet-Sun region near the limb observed by Hinode/SOT/SP. The inserts at 7° and 35° from the limb (red crosses) are centred close to the maximum viewing angles of the solar poles from the ecliptic and from Solar Orbiter, respectively. The enhanced contrast signal at 35° viewing angle allows for a superior determination of the atmospheric parameters. The grey scales of both inserts cover the same dynamic range, but are individually centred to their mean intensity values.
Current usage metrics show cumulative count of Article Views (full-text article views including HTML views, PDF and ePub downloads, according to the available data) and Abstracts Views on Vision4Press platform.
Data correspond to usage on the plateform after 2015. The current usage metrics is available 48-96 hours after online publication and is updated daily on week days.
Initial download of the metrics may take a while.