| Issue |
A&A
Volume 641, September 2020
|
|
|---|---|---|
| Article Number | L3 | |
| Number of page(s) | 3 | |
| Section | Letters to the Editor | |
| DOI | https://doi.org/10.1051/0004-6361/202038815 | |
| Published online | 01 September 2020 | |
Letter to the Editor
Curiosity Mars methane measurements are not confused by ozone
1
NASA Jet Propulsion Laboratory, California Institute of Technology, Pasadena, CA, USA
e-mail: This email address is being protected from spambots. You need JavaScript enabled to view it.
2
NASA Goddard Space Flight Center, Greenbelt, MD, USA
3
University of Michigan, Ann Arbor, MI, USA
Received:
1
July
2020
Accepted:
9
August
2020
Abstract
In the detection of methane in the atmosphere of Mars by the Tunable Laser Spectrometer on the Sample Analysis at Mars (TLS-SAM) on the Curiosity rover, the possibility of confusing ozone lines with those of methane is ruled out by the ultrahigh spectral resolution of the instrument. Even at the low background levels of methane (∼0.5 ppbv) detected by ingesting the atmosphere over a CO2 scrubber (Linde 13X) that enriches the methane abundance relative to CO2 by 25 times, the recorded TLS spectra show no presence of, and therefore no interference by, ozone lines. If O3 lines were to appear in the TLS spectra, they would be readily distinguishable from those of CH4. The inability of TLS-SAM to detect ozone spectral lines above its noise levels is consistent with a report that O3 decomposes in the presence of Linde 13X material, so that it would not arrive at the TLS sample cell in a significant quantity. With the exact enrichment factor for ozone undetermined, TLS-SAM is unable to produce meaningful upper limits to the atmospheric ozone abundance.
Key words: techniques: spectroscopic / infrared: general / methods: analytical / planets and satellites: atmospheres
© ESO 2020
1. Introduction
In their paper “First detection of ozone in the mid-infrared at Mars: Implications for methane detection”, Olsen et al. (2020) report high spectral resolution measurements made by the Atmospheric Chemistry Suite (ACS; Korablev et al. 2018) onboard the ExoMars Trace Gas Orbiter (TGO). Ozone abundances of ∼50–200 parts per billion by volume (ppbv) are reported at altitudes below ∼20 km at high northern latitudes (> 65°N). In addition to reporting ozone measurements, Olsen et al. (2020) compare observed and modeled spectra of methane and ozone in the 3.3 μm region and identify regions of spectral overlap used by the orbiter (Planetary Fourier Spectrometer (PFS) on Mars Express: Formisano et al. 2004, Giuranna et al. 2019), ground-based (Krasnopolsky et al. 2004; Mumma et al. 2009), and by the Curiosity Mars rover (Webster et al. 2015, 2018). Olsen et al. (2020) consider the implications for these prior measurements of methane, and suggest that these may all be impacted by, or attributed to, the presence of ozone, not methane, in the martian atmosphere. This interpretation would better reconcile (i) the short lifetimes of methane implied by the prior measurements if the short-lived (days) ozone were instead responsible; and (ii) the non-detection of methane in the Mars atmosphere by the ACS-TGO instrument (Korablev et al. 2019).
Of concern in this paper is the suggestion by Olsen et al. (2020) that the occurrence of ozone spectral lines in the wavelength region used by the Tunable Laser Spectrometer (TLS) in the Sample Analysis at Mars (SAM) suite on Curiosity may interfere with the measurement of atmospheric methane, particularly at low abundances. The measurements and models of Olsen et al. (2020) show that even at the equatorial latitude of Curiosity, significant ozone abundances may occur at the near surface. In particular, they suggest that because ozone may be enriched in the same way as methane in the TLS-SAM instrument (Webster et al. 2018), then the enrichment measurements of the background methane abundances (∼0.5 ppbv) could be contaminated by a contribution from atmospheric ozone, which is highest during the martian night when TLS-SAM takes its measurements.
The TLS-SAM instrument has been described in great detail in earlier publications (Webster et al. 2015, 2018, and supplementary material SM), and has reported nighttime background methane abundances averaging ∼0.41 ± 0.16 ppbv (95% confidence interval) that vary seasonally, in addition to a few sporadic spikes up to ∼20 ppbv (Moores et al. 2019, SM) seen over the last six years in the near-surface environment of Curiosity. By comparing here the recorded TLS-SAM enrichment spectra with those generated by the HITRAN 2016 model (Gordon et al. 2017), we demonstrate the fidelity of the TLS-SAM measurements in unambiguously detecting methane, with no hint of ozone seen in the enrichment runs.
2. Observations
The power of TLS-SAM to discern methane from ozone despite the occurrence of spectral features in the same wavelength region is thanks to its ultra-high spectral resolution. For TLS-SAM, its resolving power of λ/dλ is ∼10 million, compared to that for ACS-TGO of ∼30 000. This means the TLS-SAM laser linewidth is only a fraction of the Doppler-limited molecular linewidths for both methane and ozone at martian pressures near 7 mbar. Individual rotational lines within the vibrational band are readily resolved.
Following evacuation with the SAM wide-range turbomolecular pump, the TLS instrument detects low background levels of methane in situ by ingesting a sample of the Mars atmosphere and passing it over a CO2 scrubber (Linde 13X molecular sieve; Webster et al. 2018, SM) that serves to remove most of the atmospheric CO2 while allowing CH4 to pass through unchanged. Laboratory calibrations pre-launch determined that with this identical hardware the mixing ratio of the CH4 delivered to the sample cell is enriched by a factor of 25. For CH4 in TLS then, the resulting enrichment factor (EF) is 25. Once the gas sample is collected in the TLS sample cell (Herriott cell), methane abundances are determined by subtracting the empty (evacuated) cell mixing ratios (that include a foreoptics chamber terrestrial contribution) from the full cell data. Because absorption levels are low, the scanning semiconductor laser is modulated at ∼10 kHz to allow the generation of second-harmonic (2f) spectra to improve signal-to-noise. In calibration runs pre-launch, the 2f spectra are tied to the direct absorption spectra from both TLS and from HITRAN simulations to retrieve identical methane abundances.
Figure 1 shows our recorded 2f spectra (middle two traces) compared to HITRAN simulations for both methane and ozone, all at typical Mars pressures of 7 mbar (see Webster et al. 2015, 2018, SM for description of the 2f method, and the enrichment protocol). At its ultrahigh resolution, it is immediately clear that TLS-SAM can readily distinguish methane from ozone, despite the fact that ozone has a triplet-like feature overlapping the exact wave number of the methane R(3) triplet at 3057.7 cm−1 used by TLS-SAM (Webster et al. 2015, 2018).
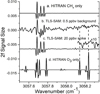 |
Fig. 1. Comparison of TLS-SAM actual spectra (middle two traces b and c) recorded using enrichment compared with HITRAN 2016 simulations for both pure methane (top trace a) and pure ozone (bottom trace d). The TLS-SAM spectra shown result from the subtraction of the empty cell (including foreoptics chamber contribution) from the full cell after enrichment (see Webster et al. 2018, supplementary material). The HITRAN CH4 and O3 spectra are calculated using TLS-SAM parameters (e.g., spectral resolution) but their amplitudes are scaled to produce features of a similar size to the observed CH4 R(3) triplet, thereby demonstrating the absence of the two strong ozone lines near 3058.2 cm−1. The TLS-SAM spectrum in the second trace (b) is recorded using enrichment where background levels (∼0.5 ppbv) of methane are reported. Prior to subtraction, the full cell and empty cell spectra are produced by averaging spectra from six enrichment runs, taken on sols 573, 684, 1322, 1451, 2075, and 2627 that produced an average background level of 0.5 ppbv. The TLS-SAM spectrum in the third trace (c) is from a high methane spike (∼20 ppbv) recorded on sol 2442 in June 2019. Shown to the upper right of this trace is the section over the O3 line region where the vertical amplitude is increased by ×10. In either the second (b) or third (c) traces, O3 lines are not detected. |
3. Results and discussion
Prior methane measurement instruments on orbiting or ground-based platforms typically have spectral resolving powers approaching or similar to that of ACS-TGO, so that the spectral overlaps noted by Olsen et al. (2020) must be considered in evaluating the relative contribution of ozone to methane detection. For the laser-based TLS instrument in SAM, the ultrahigh resolution allows this comparison unambiguously.
For the identification of either methane or ozone in a spectral region, we must consider that all spectral lines must be present and must all grow or decline together with increasing or decreasing gas abundance. Even if TLS were to have somehow misidentified the R(3) triplet of CH4 near 3057.7 cm−1, the discriminating test is in the absence of the strongest O3 line at 3058.23 cm−1. Therefore, the TLS spectral lines are identified as belonging to methane and not to ozone by (i) the triplet spacing and intensity sequence of 1:0.6:0.6 that is not matched by ozone; and (ii) the absence of the two ozone lines near 3058.2 cm−1. This unambiguity in methane detection is demonstrated in examples of our enrichment results for both our background (∼0.5 ppbv) spectra and the spectra of a high methane spike (∼20 ppbv). We note also, that as expected in a foreoptics chamber sealed for several years, we have not detected ozone lines throughout the mission.
Even if atmospheric O3 is ingested into TLS-SAM at the levels observed by Olsen et al. (2020), the O3 line strengths and resulting signal amplitudes are relatively small compared to CH4 in this region. For the O3 line at 3058.23 cm−1 to be equal in amplitude to the strong CH4 line at 3057.68 cm−1, the O3 abundance would need to be ∼300 times as high as that of CH4. That is, 150 ppbv O3 is needed to produce a line of equal size to that of CH4 resulting from 0.5 ppbv.
The ability of TLS-SAM to detect O3 at the expected atmospheric levels is determined by the ability of O3 to efficiently pass through the scrubber/enrichment cell. For clarity, check usage of “/”. See language guide Sect. 3.6., that is, by the achieved EF for O3 in SAM. To assess that, we used the spectral noise levels from Fig. 1 near 3058.23 cm−1 where the O3 line is expected to be seen to establish upper limits for atmospheric ozone for various enrichment factor scenarios. The observed peak-to-peak noise level is about 6% of the size of the CH4 lines. This means that if the EF for O3 is indeed 25, the estimated upper limit for atmospheric O3 ingested is ∼8 ppbv, well below the abundance levels of 50–200 ppbv reported by Olsen et al. (2020), so that TLS-SAM should have readily detected O3. However, if the ingested ozone is trapped in the enrichment cell to the same extent as CO2, so that it is not enriched (EF = 1), then the upper limit for atmospheric O3 is ∼200 ppbv, and the O3 line remains undetected. The ACS-TGO measurements of O3 (Olsen et al. 2020) indicate that about 100 ppbv of O3 occur at the near surface of Mars, so that the non-detection of O3 by TLS-SAM implies that the EF for O3 must be no larger than 2 but due to the expected seasonal and other variability in atmospheric ozone, this is highly uncertain.
The adsorption of gases on molecular sieve materials like the Linde 13X used in SAM is not easily predicted, since it is dependent on a combination of factors including the pore size and material, and the gas properties of molecular kinetic diameter, critical and boiling point temperatures, and polarity. Molecular kinetic diameter does not play a key role for the Linde 13X since the diameter values for CO2 (330 pm) and CH4 (380 pm) are comparable but show very different enrichments. An accepted predictor of physical adsorption is in the relative critical and boiling point temperatures (Liffick 1969). Gases such as H2, N2, and O2 with critical temperatures of < 50°C and boiling points < − 150°C are practically non-adsorbable, while gases with critical temperatures between 0 and 150°C and boiling points between −100 and 0°C are more adsorbable. Thus, CO2 is expected to be strongly adsorbed, while CH4 is not expected to be adsorbed, as we see in the SAM enrichment process that scrubs out CO2 while allowing CH4 to pass through. Ozone, with its critical temperature of −12°C and boiling point of −112°C, is predicted to be only slightly physically adsorbed by the molecular sieve material. However, unlike the non-polar CO2 and CH4 molecules, O3 is polar (dipole moment 0.53 Debye) so that one might expect O3 to be preferentially adsorbed due to interaction with cation adsorption sites within the sieve material, allowing O3 to be delivered to the TLS sample cell.
The overriding and unique property of O3 in determining its ability to pass through the molecular sieve in the enrichment cell is its instability, since ozone readily decomposes in the gas phase due to a variety of processes (UV photolysis, reaction with O atoms, reduction by metallic surfaces, thermal decomposition) with a lifetime that can range from minutes to many hours. Surface chemistry and interactions drive its thermal decomposition with a room temperature lifetime of tens of minutes to many hours depending on the nature of the vessel and its cleanliness (Rüütel et al. 1999). Specifically, O3 has been shown (Chao et al. 2007) to be highly unstable on the Linde 13X material, and its dissociation on that material to produce O atoms has in fact been used to remove harmful toluene in locations of occupational exposure. The results of the Chao et al. (2007) study demonstrate that O3 does not pass efficiently through Linde 13X molecular sieve material used in the SAM enrichment cell, so that a TLS-SAM enrichment factor for ozone that is significantly below that of CH4 is expected.
In conclusion, the recorded TLS-SAM spectra clearly show the R(3) triplet spectral line intensity sequence fingerprint of CH4, and an absence of O3 lines, most notably at 3058.23 cm−1, confirming that the TLS-SAM measurements of atmospheric methane (even at low background levels) are not impacted by the presence of, or interference by, atmospheric ozone in the martian atmosphere.
Acknowledgments
The research described here was carried out in part at the Jet Propulsion Laboratory, California Institute of Technology, under a contract with the National Aeronautics and Space Administration (80NM0018D0004). Funding from NASA’s Planetary Science Division is acknowledged by all authors CW, PM, SA, GF, CM, and AV. ©2020.
References
- Chao, C. Y. H., Kwong, C., & Hui, K. 2007, J. Hazard Mater., 143, 118 [CrossRef] [Google Scholar]
- Formisano, V., Atreya, S., Encrenaz, T., Ignatiev, N., & Giuranna, M. 2004, Sci., 306, 1758 [Google Scholar]
- Giuranna, M., Viscardy, S., Daerden, F., et al. 2019, Nat. Geosci., 12, 326 [NASA ADS] [CrossRef] [Google Scholar]
- Gordon, I. E., Rothman, L. S., Hill, C., et al. 2017, J. Quant. Spectr. Rad., 203, 3 [NASA ADS] [CrossRef] [Google Scholar]
- Korablev, O., Montmessin, F., Trokhimovskiy, A., et al. 2018, Space Sci. Rev., 214, 7 [NASA ADS] [CrossRef] [Google Scholar]
- Korablev, O., Vandaele, A. C., Montmessin, F., et al. 2019, Nat., 568, 517 [Google Scholar]
- Krasnopolsky, V. A., Maillard, J. P., & Owen, T. C. 2004, Icarus, 172, 537 [NASA ADS] [CrossRef] [Google Scholar]
- Liffick, G. L. 1969, Master’s Thesis, Oregon State University, USA [Google Scholar]
- Moores, J. E., King, P. L., Smith, C. L., et al. 2019, Geophys Res Lett, 46, 9430 [Google Scholar]
- Mumma, M. J., Villanueva, G. L., Novak, R. E., et al. 2009, Sci, 323, 1041 [Google Scholar]
- Olsen, K., Lefèvre, F., Montmessin, F., et al. 2020, A&A, 639, A141 [CrossRef] [EDP Sciences] [Google Scholar]
- Rüütel, P. I., Griffiths, J., Xiong, F., & Barratt, P. 1999, Ozone-Technical Aspects of its Generation and Use, Knowledge paper no. 3 (Air Products and Chemicals Inc.) [Google Scholar]
- Webster, C. R., Mahaffy, P. R., Atreya, S. K., et al. 2015, Science, 347, 415 [NASA ADS] [CrossRef] [Google Scholar]
- Webster, C. R., Mahaffy, P. R., Atreya, S. K., et al. 2018, Science, 360, 1093 [CrossRef] [Google Scholar]
All Figures
|
Fig. 1. Comparison of TLS-SAM actual spectra (middle two traces b and c) recorded using enrichment compared with HITRAN 2016 simulations for both pure methane (top trace a) and pure ozone (bottom trace d). The TLS-SAM spectra shown result from the subtraction of the empty cell (including foreoptics chamber contribution) from the full cell after enrichment (see Webster et al. 2018, supplementary material). The HITRAN CH4 and O3 spectra are calculated using TLS-SAM parameters (e.g., spectral resolution) but their amplitudes are scaled to produce features of a similar size to the observed CH4 R(3) triplet, thereby demonstrating the absence of the two strong ozone lines near 3058.2 cm−1. The TLS-SAM spectrum in the second trace (b) is recorded using enrichment where background levels (∼0.5 ppbv) of methane are reported. Prior to subtraction, the full cell and empty cell spectra are produced by averaging spectra from six enrichment runs, taken on sols 573, 684, 1322, 1451, 2075, and 2627 that produced an average background level of 0.5 ppbv. The TLS-SAM spectrum in the third trace (c) is from a high methane spike (∼20 ppbv) recorded on sol 2442 in June 2019. Shown to the upper right of this trace is the section over the O3 line region where the vertical amplitude is increased by ×10. In either the second (b) or third (c) traces, O3 lines are not detected. |
| In the text | |
Current usage metrics show cumulative count of Article Views (full-text article views including HTML views, PDF and ePub downloads, according to the available data) and Abstracts Views on Vision4Press platform.
Data correspond to usage on the plateform after 2015. The current usage metrics is available 48-96 hours after online publication and is updated daily on week days.
Initial download of the metrics may take a while.