Fig. 1.
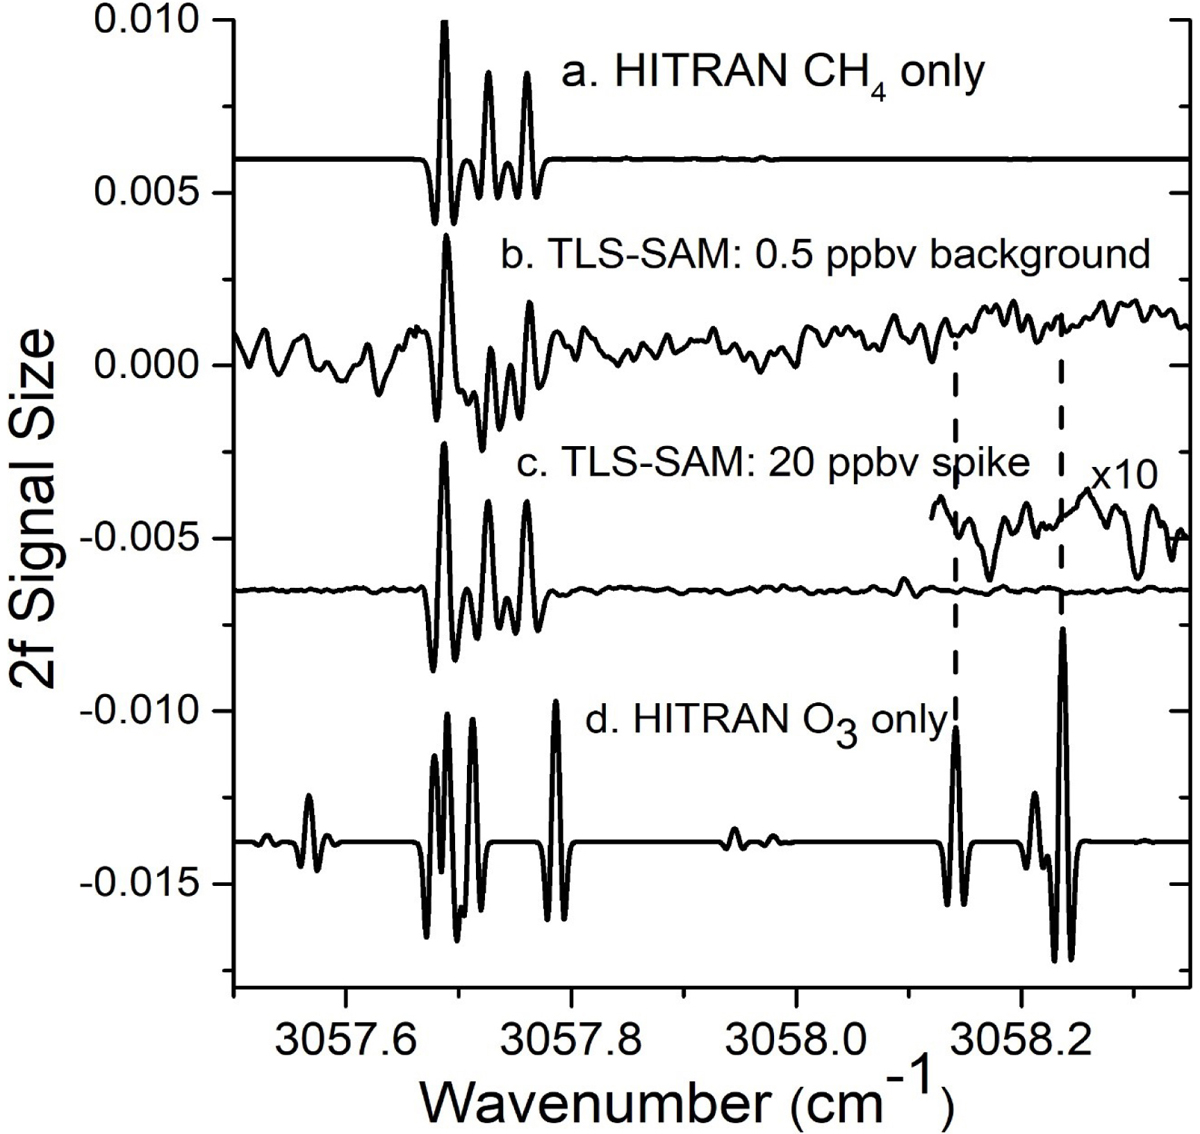
Comparison of TLS-SAM actual spectra (middle two traces b and c) recorded using enrichment compared with HITRAN 2016 simulations for both pure methane (top trace a) and pure ozone (bottom trace d). The TLS-SAM spectra shown result from the subtraction of the empty cell (including foreoptics chamber contribution) from the full cell after enrichment (see Webster et al. 2018, supplementary material). The HITRAN CH4 and O3 spectra are calculated using TLS-SAM parameters (e.g., spectral resolution) but their amplitudes are scaled to produce features of a similar size to the observed CH4 R(3) triplet, thereby demonstrating the absence of the two strong ozone lines near 3058.2 cm−1. The TLS-SAM spectrum in the second trace (b) is recorded using enrichment where background levels (∼0.5 ppbv) of methane are reported. Prior to subtraction, the full cell and empty cell spectra are produced by averaging spectra from six enrichment runs, taken on sols 573, 684, 1322, 1451, 2075, and 2627 that produced an average background level of 0.5 ppbv. The TLS-SAM spectrum in the third trace (c) is from a high methane spike (∼20 ppbv) recorded on sol 2442 in June 2019. Shown to the upper right of this trace is the section over the O3 line region where the vertical amplitude is increased by ×10. In either the second (b) or third (c) traces, O3 lines are not detected.
Current usage metrics show cumulative count of Article Views (full-text article views including HTML views, PDF and ePub downloads, according to the available data) and Abstracts Views on Vision4Press platform.
Data correspond to usage on the plateform after 2015. The current usage metrics is available 48-96 hours after online publication and is updated daily on week days.
Initial download of the metrics may take a while.