Fig. 2.
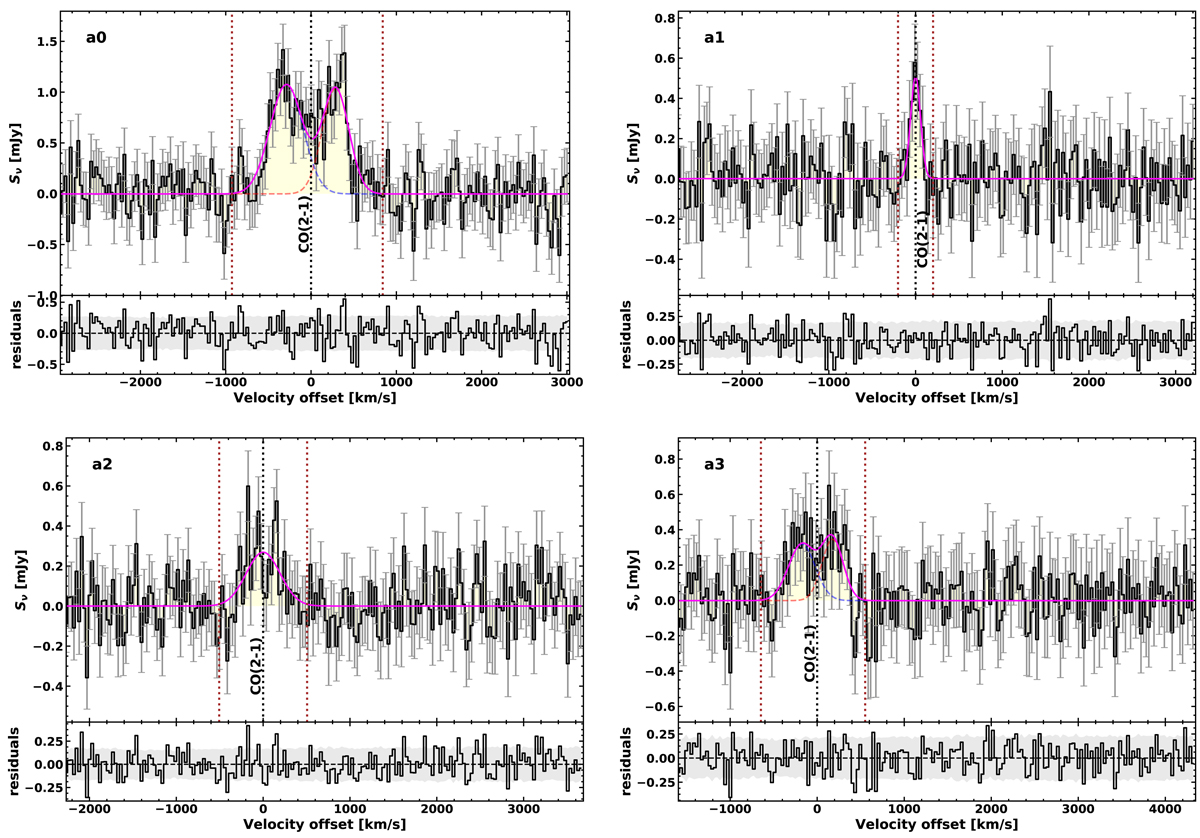
ALMA spectra of the four detected sources (channel width of 30 km s−1). For each spectrum, the top panel shows the data extracted from the datacubes (solid black line) as a function of the radial velocity offset (increasing with redshift) from the detected line center. The gray bars represent the uncertainty per channel measured on the noise map. The solid magenta line marks the total model, i.e., the sum of the two components (dashed red and blue lines). The rest-frame zero-velocity is set to the central frequency of the fitted line (dotted black vertical line). For two-component fits, the central frequency of the line is set to the mean of the central frequencies of the two components. The vertical dotted brown lines delimit the velocity range within which we computed the moments. For the two-component fits, the range spans from the low-velocity side of the blueshifted to the high-velocity side of the redshifted component. The source ID is reported in the top left corner. Bottom panels: residuals when the total model is subtracted from the data. The shaded gray region shows the rms per channel, indicating the 1σ range.
Current usage metrics show cumulative count of Article Views (full-text article views including HTML views, PDF and ePub downloads, according to the available data) and Abstracts Views on Vision4Press platform.
Data correspond to usage on the plateform after 2015. The current usage metrics is available 48-96 hours after online publication and is updated daily on week days.
Initial download of the metrics may take a while.