Fig. 1.
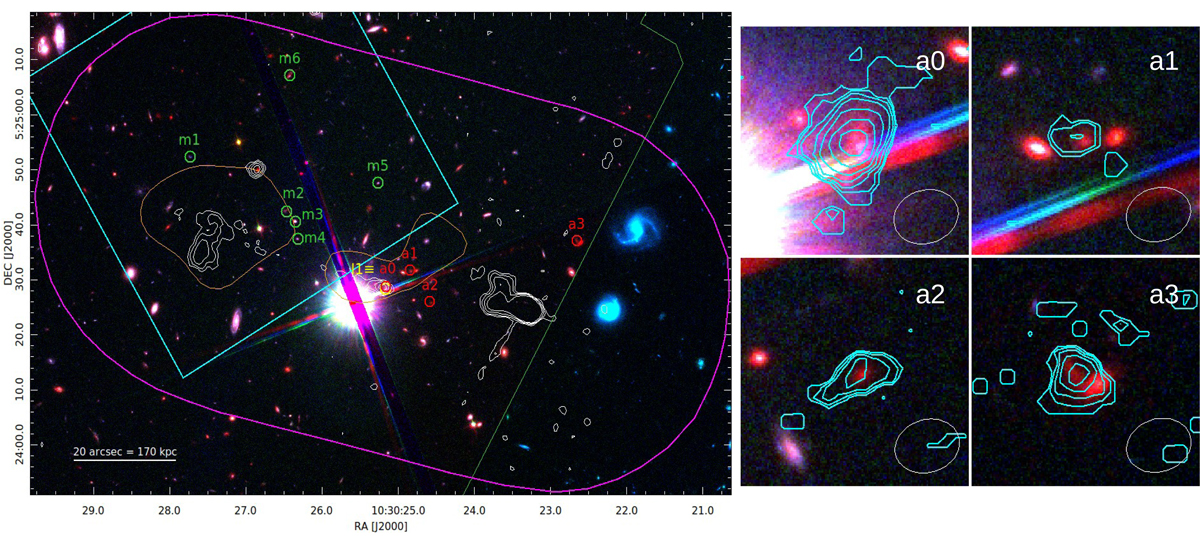
Left: composed r − g − b image of the field around the FRII radio galaxy. Red, green, and blue channels are the HST F160W, F850lP, and F775W filters. Green and red circles mark the MUSE (m1−m6) and ALMA (a0−a3) sources, respectively. a0 (the FRII core) corresponds to the LUCI source l1, marked in yellow. A second LUCI source, l2, is located ∼1.5 arcmin southeast of a0, outside the image. VLA contours at 1.4 GHz are overlaid in white, starting at the ∼3σ level emission and increasing with a ![]() geometric progression. The orange contours mark the ∼2.5σ level of the diffuse X-ray emission (0.5−7 keV). The solid green polygon delimits the region covered simultaneously by all HST filters. The solid magenta line and cyan box are the ALMA HPBW and MUSE FoV, respectively. The solid white line in the bottom left corner is the angular and physical scale. Right: ∼7 × 7 arcsec2 (∼60 × 60 kpc2) cutouts of the composed HST r − g − b image, centered on the ALMA detected sources (named as labeled). The cyan contours represent the 3σ moments 0 map of our observations (see Sect. 2.3), starting at the ∼3σ level emission and increasing with a
geometric progression. The orange contours mark the ∼2.5σ level of the diffuse X-ray emission (0.5−7 keV). The solid green polygon delimits the region covered simultaneously by all HST filters. The solid magenta line and cyan box are the ALMA HPBW and MUSE FoV, respectively. The solid white line in the bottom left corner is the angular and physical scale. Right: ∼7 × 7 arcsec2 (∼60 × 60 kpc2) cutouts of the composed HST r − g − b image, centered on the ALMA detected sources (named as labeled). The cyan contours represent the 3σ moments 0 map of our observations (see Sect. 2.3), starting at the ∼3σ level emission and increasing with a ![]() geometric progression. The white ellipse in the bottom right corners represents the restoring beam.
geometric progression. The white ellipse in the bottom right corners represents the restoring beam.
Current usage metrics show cumulative count of Article Views (full-text article views including HTML views, PDF and ePub downloads, according to the available data) and Abstracts Views on Vision4Press platform.
Data correspond to usage on the plateform after 2015. The current usage metrics is available 48-96 hours after online publication and is updated daily on week days.
Initial download of the metrics may take a while.