Fig. 6
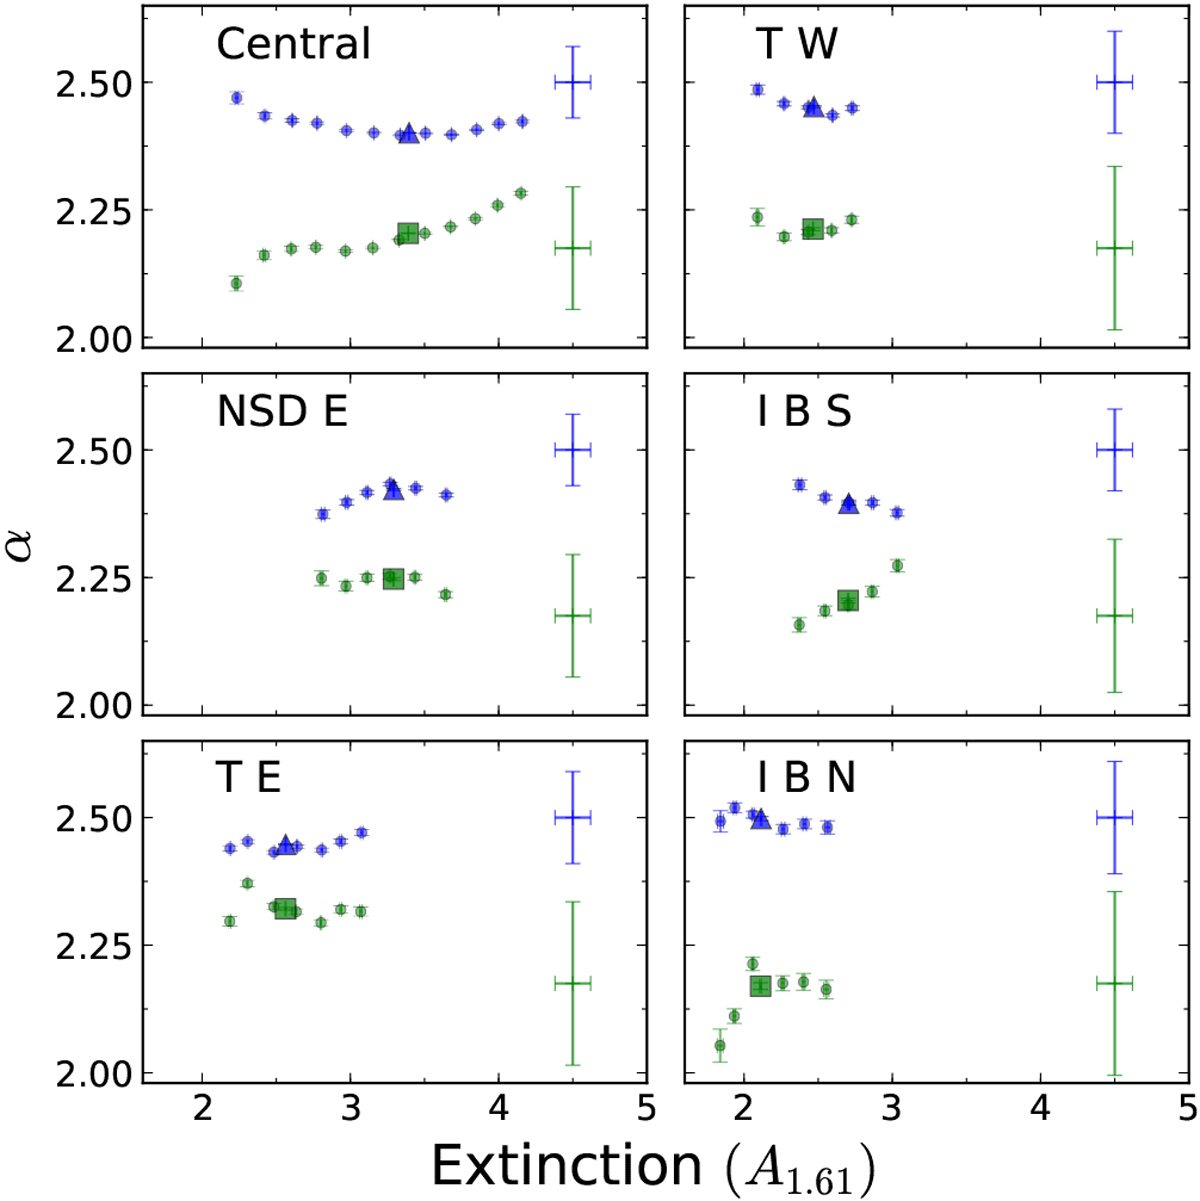
Extinction index variability with the absolute extinction (A1.61) for six different regions of the GALACTICNUCLEUS survey (indicated for each panel). The upper blue points and lower green ones indicate the values of
αJH and ![]() for each absolute extinction A1.61, including the statistical uncertainties. Big blue triangles and green squares indicate the average value per region obtained in Table 2. The blue and green crosses indicate the systematic uncertainties due to the ZP computed for each region.
for each absolute extinction A1.61, including the statistical uncertainties. Big blue triangles and green squares indicate the average value per region obtained in Table 2. The blue and green crosses indicate the systematic uncertainties due to the ZP computed for each region.
Current usage metrics show cumulative count of Article Views (full-text article views including HTML views, PDF and ePub downloads, according to the available data) and Abstracts Views on Vision4Press platform.
Data correspond to usage on the plateform after 2015. The current usage metrics is available 48-96 hours after online publication and is updated daily on week days.
Initial download of the metrics may take a while.