Fig. 5
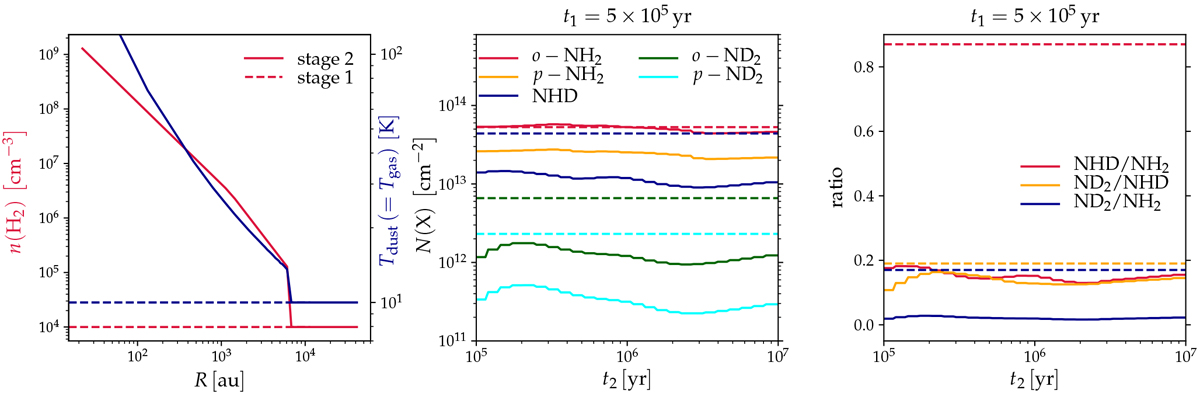
Left panel: density (red) and temperature (blue) structure in the IRAS16293 source model in stages 1 and 2 (see Sect. 5 for details). Middle panel: modeled beam-convolved molecular column densities (solid lines, labeled in the plot) as functions of time in stage 2. Dashed lines represent the observed values, omitting error bars for clarity. Right panel: modeled D/H ratios (solid lines, labeled in the plot) as functions of time in stage 2. Here, the NH2 and ND2 abundances have been summed over the ortho and para forms. Dashed lines represent the observed values, for which the error bars have again been omitted.
Current usage metrics show cumulative count of Article Views (full-text article views including HTML views, PDF and ePub downloads, according to the available data) and Abstracts Views on Vision4Press platform.
Data correspond to usage on the plateform after 2015. The current usage metrics is available 48-96 hours after online publication and is updated daily on week days.
Initial download of the metrics may take a while.