Free Access
Fig. 1
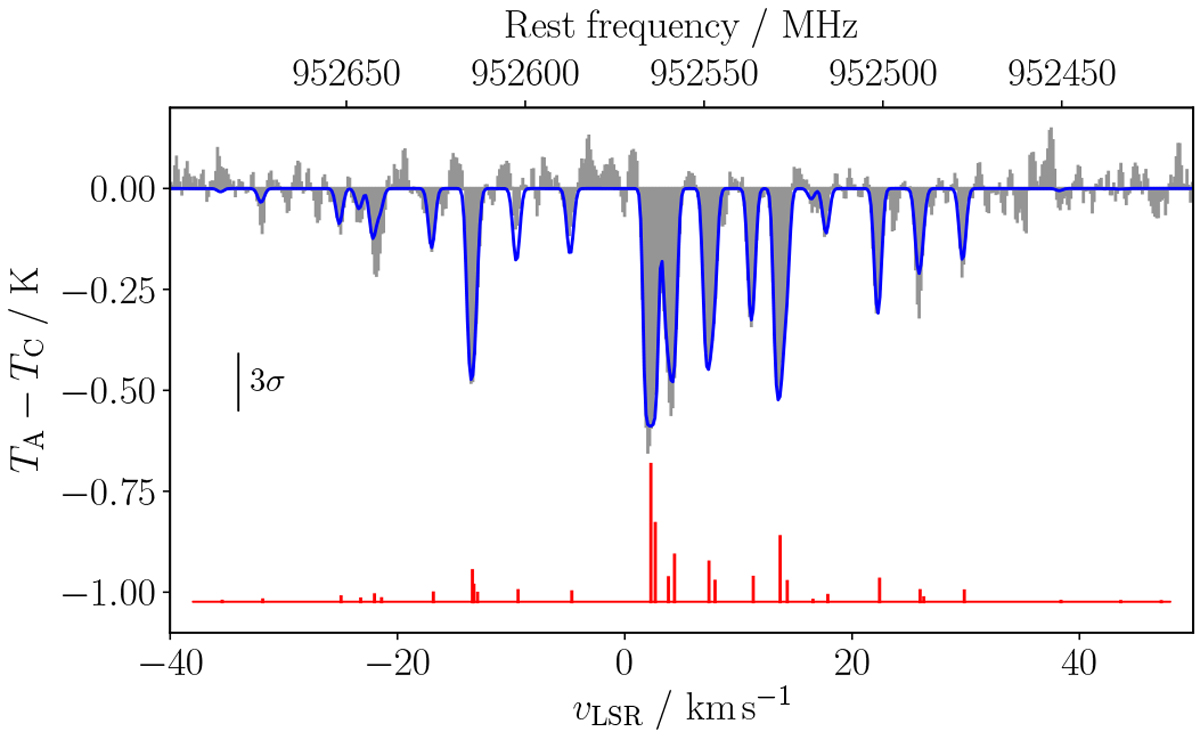
Spectrum of the ![]() component of the NKa,Kc = 11,1 − 00,0
o-NH2 transition around 952 GHz observed toward IRAS 16293-2422 The filled gray histograms show the observed spectra, while the blue trace is our HFS fit. The red bars represent the positions of the HFS components assuming LTE intensities.
component of the NKa,Kc = 11,1 − 00,0
o-NH2 transition around 952 GHz observed toward IRAS 16293-2422 The filled gray histograms show the observed spectra, while the blue trace is our HFS fit. The red bars represent the positions of the HFS components assuming LTE intensities.
Current usage metrics show cumulative count of Article Views (full-text article views including HTML views, PDF and ePub downloads, according to the available data) and Abstracts Views on Vision4Press platform.
Data correspond to usage on the plateform after 2015. The current usage metrics is available 48-96 hours after online publication and is updated daily on week days.
Initial download of the metrics may take a while.