Fig. 4.
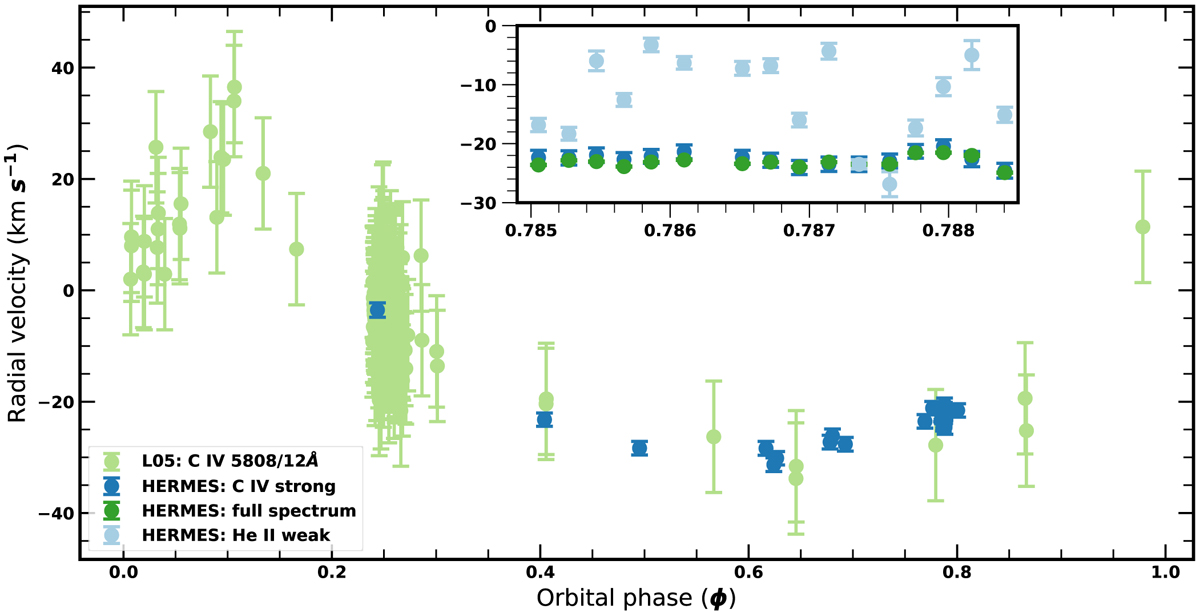
Phased RV plot for WR 137. Archival RV measurements are shown in blue and are taken from Lefèvre et al. (2005). The RV measurements from HERMES using the strong C IV lines are shown in red. Along with these measurements, the inset shows the short cadence measurements with the full spectrum (green) and weak He II lines (purple). All HERMES RV measurements have been shifted by −23.5 km s−1 in order to convert relative RV measurements to absolute values.
Current usage metrics show cumulative count of Article Views (full-text article views including HTML views, PDF and ePub downloads, according to the available data) and Abstracts Views on Vision4Press platform.
Data correspond to usage on the plateform after 2015. The current usage metrics is available 48-96 hours after online publication and is updated daily on week days.
Initial download of the metrics may take a while.