Fig. 2.
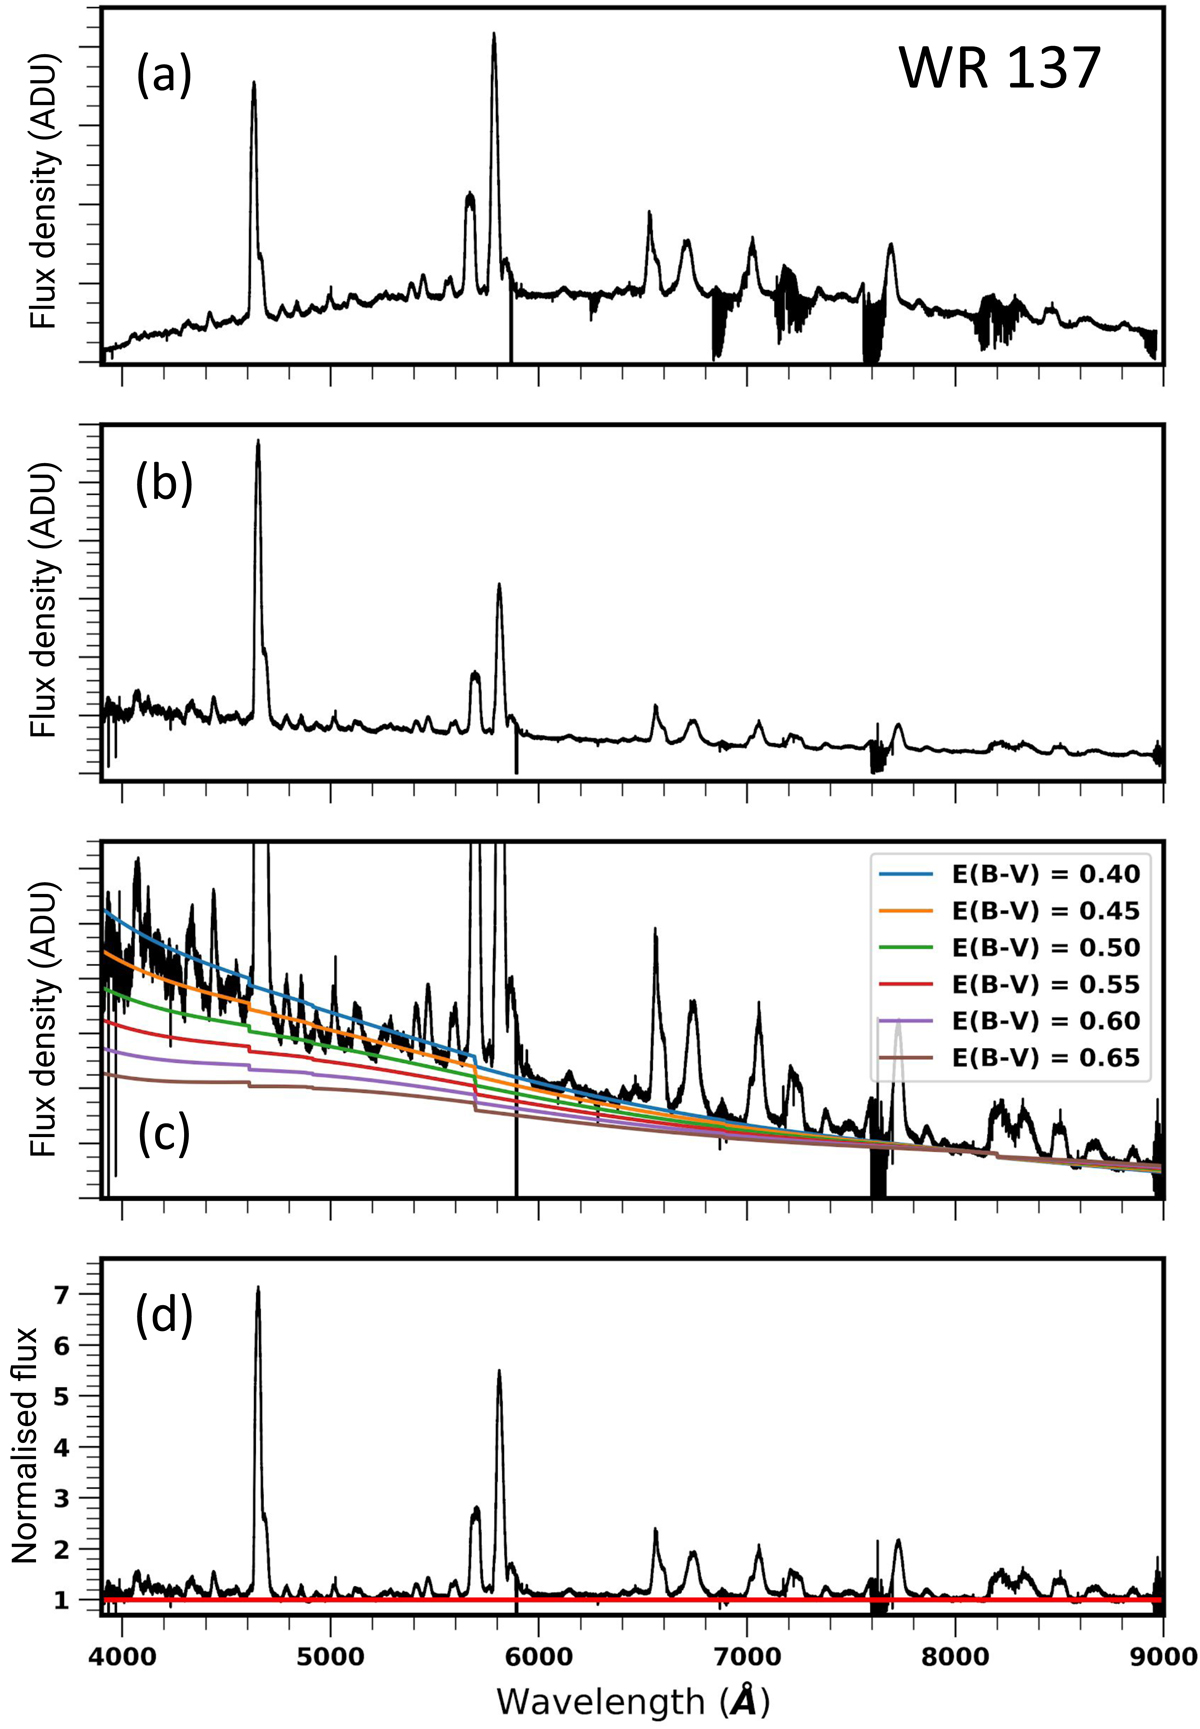
Main steps in our data reduction process. From top to bottom: (a) flatfield corrected spectrum produced by the HERMES pipeline. (b) Spectrum corrected for the instrumental response function and telluric contamination. (c) Continuum flux models from PoWR to the pseudo-continuum region around 5200 Å for different values of E(B − V). (d) Resulting normalised spectrum.
Current usage metrics show cumulative count of Article Views (full-text article views including HTML views, PDF and ePub downloads, according to the available data) and Abstracts Views on Vision4Press platform.
Data correspond to usage on the plateform after 2015. The current usage metrics is available 48-96 hours after online publication and is updated daily on week days.
Initial download of the metrics may take a while.