Fig. 6.
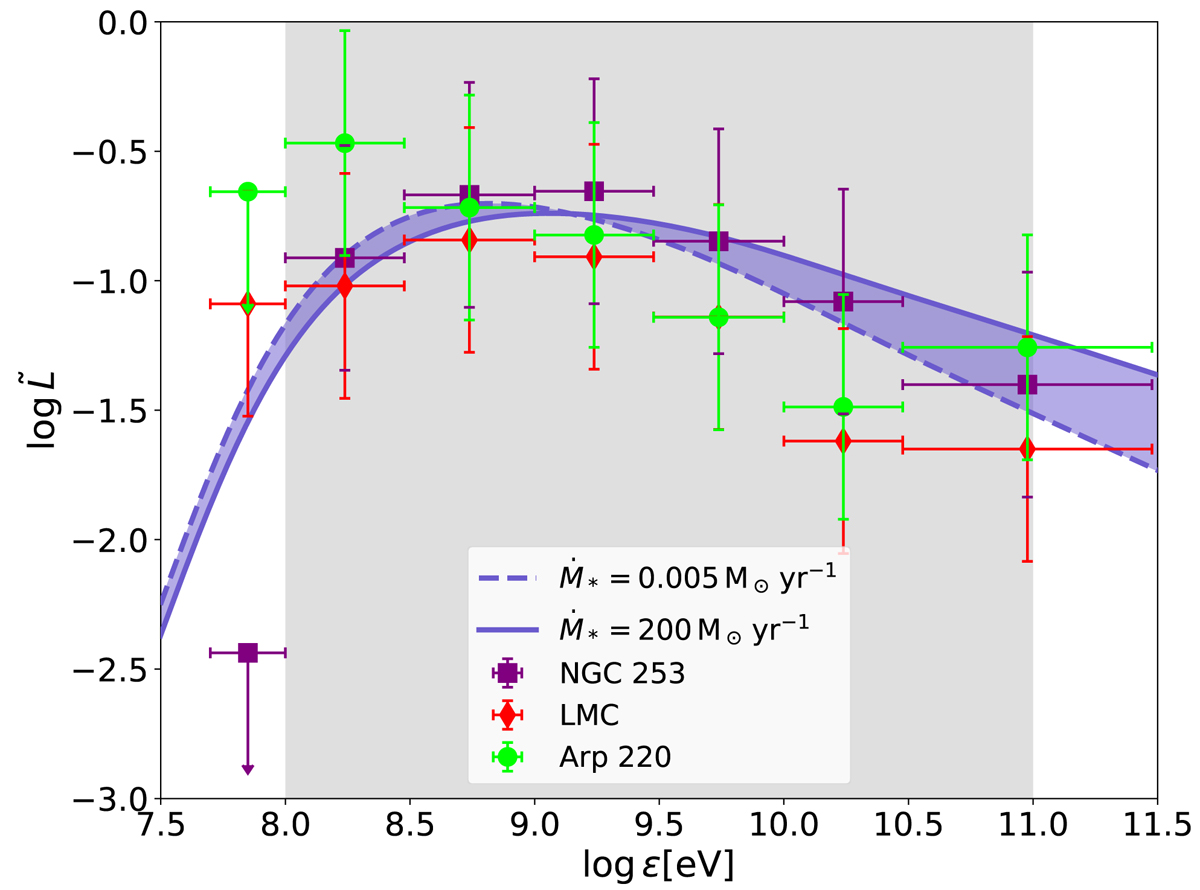
Observed normalised SEDs (![]() ) of three galaxies spanning the whole SFR range. Model galaxies with Ṁ∗ = 0.005 M⊙ yr−1 (blue dashed line) and Ṁ∗ = 200 M⊙ yr−1 (blue solid line) in our scenario K0 are also plotted. The blue shaded region is the interpolation of the model to SFRs between these values. The grey shaded region indicates the Fermi energy range.
) of three galaxies spanning the whole SFR range. Model galaxies with Ṁ∗ = 0.005 M⊙ yr−1 (blue dashed line) and Ṁ∗ = 200 M⊙ yr−1 (blue solid line) in our scenario K0 are also plotted. The blue shaded region is the interpolation of the model to SFRs between these values. The grey shaded region indicates the Fermi energy range.
Current usage metrics show cumulative count of Article Views (full-text article views including HTML views, PDF and ePub downloads, according to the available data) and Abstracts Views on Vision4Press platform.
Data correspond to usage on the plateform after 2015. The current usage metrics is available 48-96 hours after online publication and is updated daily on week days.
Initial download of the metrics may take a while.