Fig. 5.
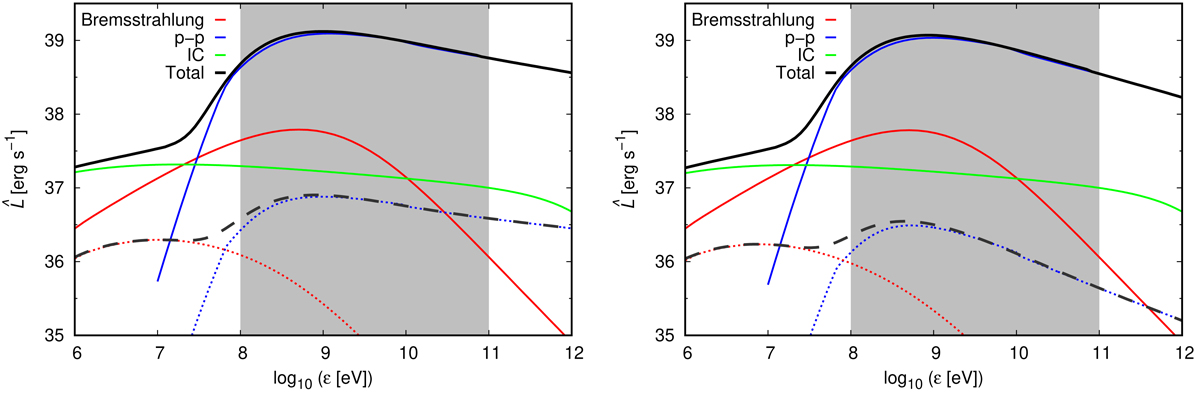
Spectra energy distributions per unit SFR for galaxies in scenarios B0 (left panel) and K0 (right panel). The luminosity divided by the SFR, ![]() is plotted, where ε is the photon energy and Lε is the specific luminosity, to simplify the comparison between galaxies of different SFRs. The solid and dashed lines correspond to Ṁ∗ = 200 and 0.005 M⊙ yr−1, respectively. The colour lines represent the individual contributions from different mechanisms (the colour code is the same as in Figs. 3 and 4), whereas the black lines show the total SED. The grey shaded region indicates the Fermi energy range.
is plotted, where ε is the photon energy and Lε is the specific luminosity, to simplify the comparison between galaxies of different SFRs. The solid and dashed lines correspond to Ṁ∗ = 200 and 0.005 M⊙ yr−1, respectively. The colour lines represent the individual contributions from different mechanisms (the colour code is the same as in Figs. 3 and 4), whereas the black lines show the total SED. The grey shaded region indicates the Fermi energy range.
Current usage metrics show cumulative count of Article Views (full-text article views including HTML views, PDF and ePub downloads, according to the available data) and Abstracts Views on Vision4Press platform.
Data correspond to usage on the plateform after 2015. The current usage metrics is available 48-96 hours after online publication and is updated daily on week days.
Initial download of the metrics may take a while.