Fig. 3.
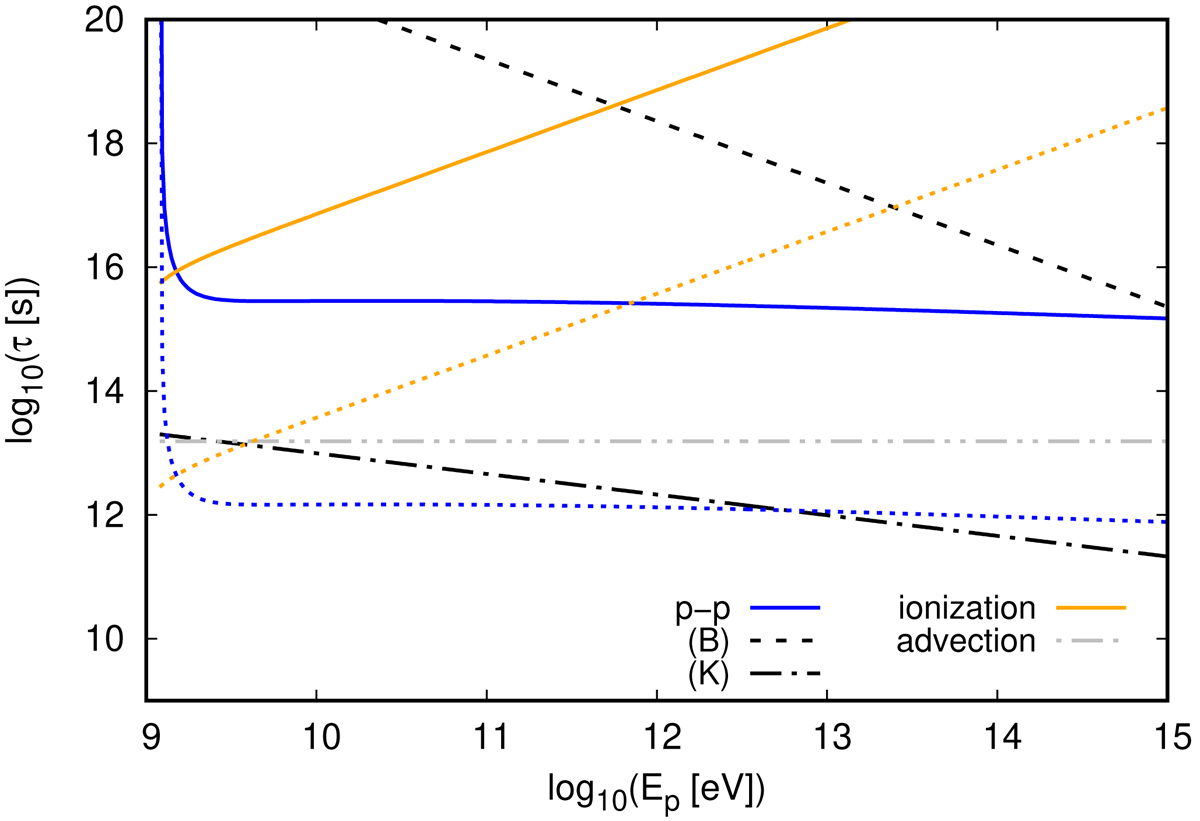
Cooling timescales for protons, as a function of energy, for two galaxies with Ṁ∗ = 0.005 (solid lines) and 200 M⊙ yr−1 (dotted lines), in the base (0) scenarios. The blue and yellow lines indicate p-p scattering and ionisation, respectively. The black lines represent diffusion timescales (dot-dashed and dashed for K0 and B0 scenarios, respectively), whereas the grey double-dot-dashed line is the advection timescale.
Current usage metrics show cumulative count of Article Views (full-text article views including HTML views, PDF and ePub downloads, according to the available data) and Abstracts Views on Vision4Press platform.
Data correspond to usage on the plateform after 2015. The current usage metrics is available 48-96 hours after online publication and is updated daily on week days.
Initial download of the metrics may take a while.