Fig. 2.
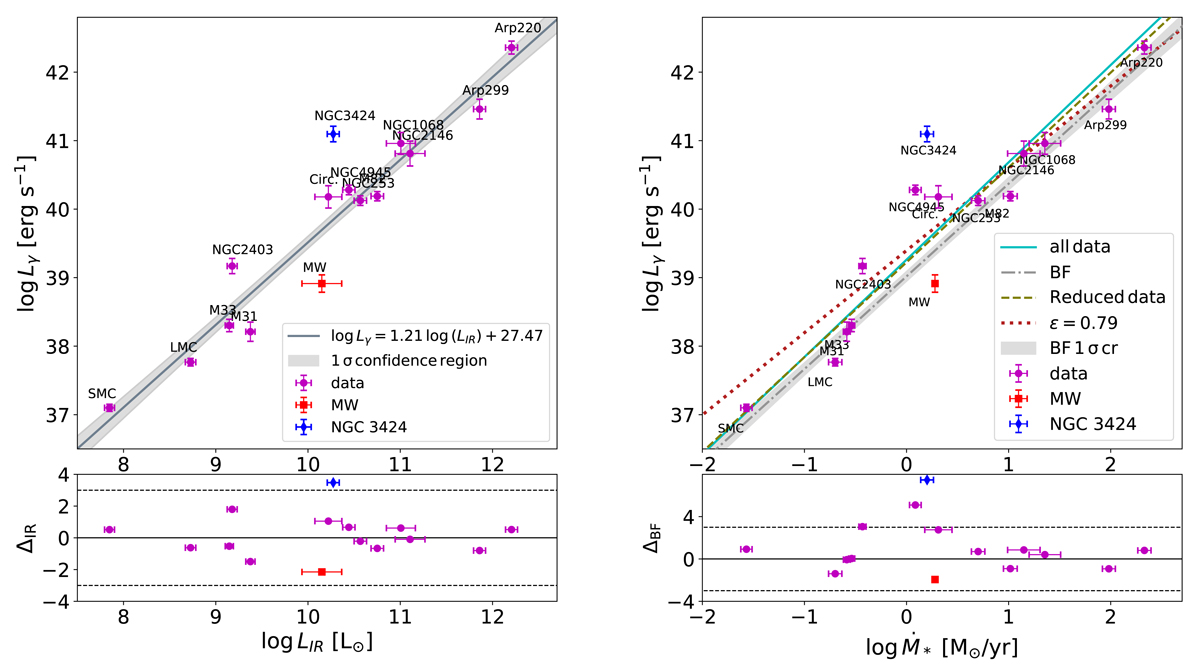
Upper left panel: γ-ray luminosity of as a function of total IR luminosity for our sample. The grey solid line represents the best fit to the data (excluding the MW and NGC 3424) and the grey shaded region shows its 68% confidence level. The trend is consistent with those found by previous works. Lower left panel: residuals of the fit, weighted by their standard deviation, as a function of the total IR luminosity. The horizontal dotted lines correspond to ±3 standard deviations. Upper right panel: γ-ray luminosity as a function of SFR. Three fits performed on different data sets are shown: the full data set (cyan solid line); a reduced data set, excluding the MW and NGC 3424( green dashed line); and the BF, excluding all galaxies in the range −0.5 < log Ṁ∗ < 0.5 (grey dot-dashed line, see text). The grey shaded region shows the 68% confidence level of the BF fit. The red dotted line represents the best fit to the Lγ–LIR relation presented in the left panel, translated into the SFR–Lγ plane by Eq. (3), with ϵ = 0.79. The latter agrees only marginally with the data or any of the other three fits. Lower right panel: residuals of the BF fit, weighted by their standard deviation, as a function of the SFR. Horizontal dotted lines correspond to ±3 standard deviations.
Current usage metrics show cumulative count of Article Views (full-text article views including HTML views, PDF and ePub downloads, according to the available data) and Abstracts Views on Vision4Press platform.
Data correspond to usage on the plateform after 2015. The current usage metrics is available 48-96 hours after online publication and is updated daily on week days.
Initial download of the metrics may take a while.