Free Access
Fig. C.1.
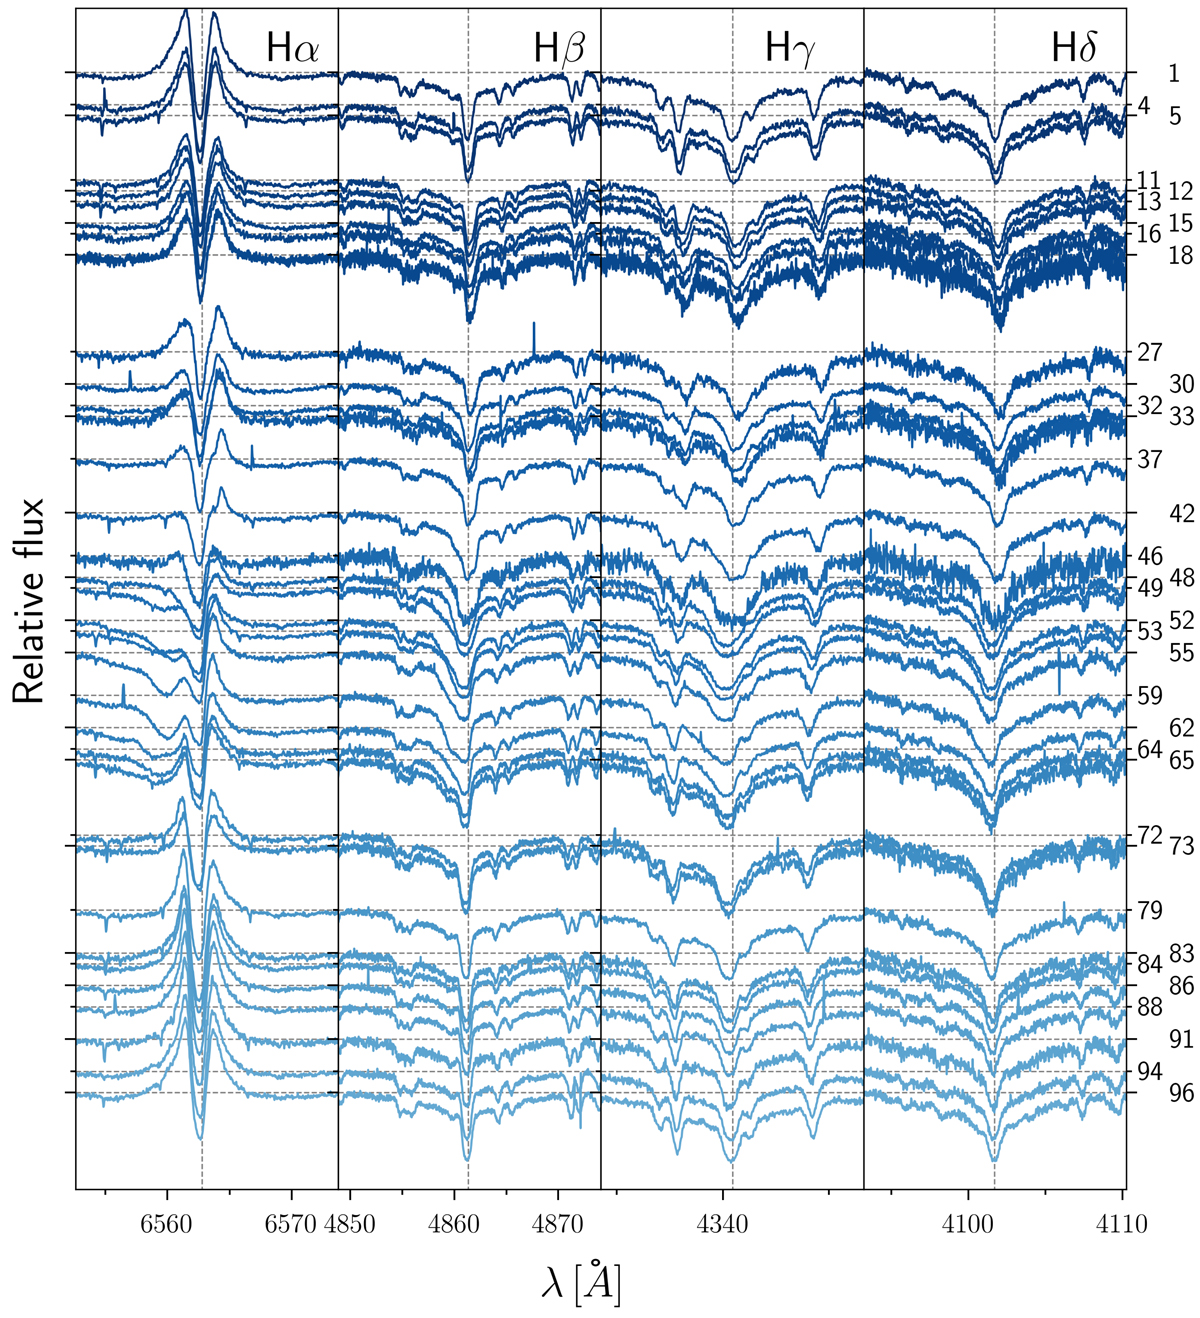
Balmer lines of BD+46°442 as a function of wavelength. The spectra are given in arbitrary units and offset according to their orbital phase. Numbers on the right vertical axis indicate the orbital phase of the spectra (from 0 to 100). The dashed vertical lines represent the centre of each Balmer line.
Current usage metrics show cumulative count of Article Views (full-text article views including HTML views, PDF and ePub downloads, according to the available data) and Abstracts Views on Vision4Press platform.
Data correspond to usage on the plateform after 2015. The current usage metrics is available 48-96 hours after online publication and is updated daily on week days.
Initial download of the metrics may take a while.