Fig. 13
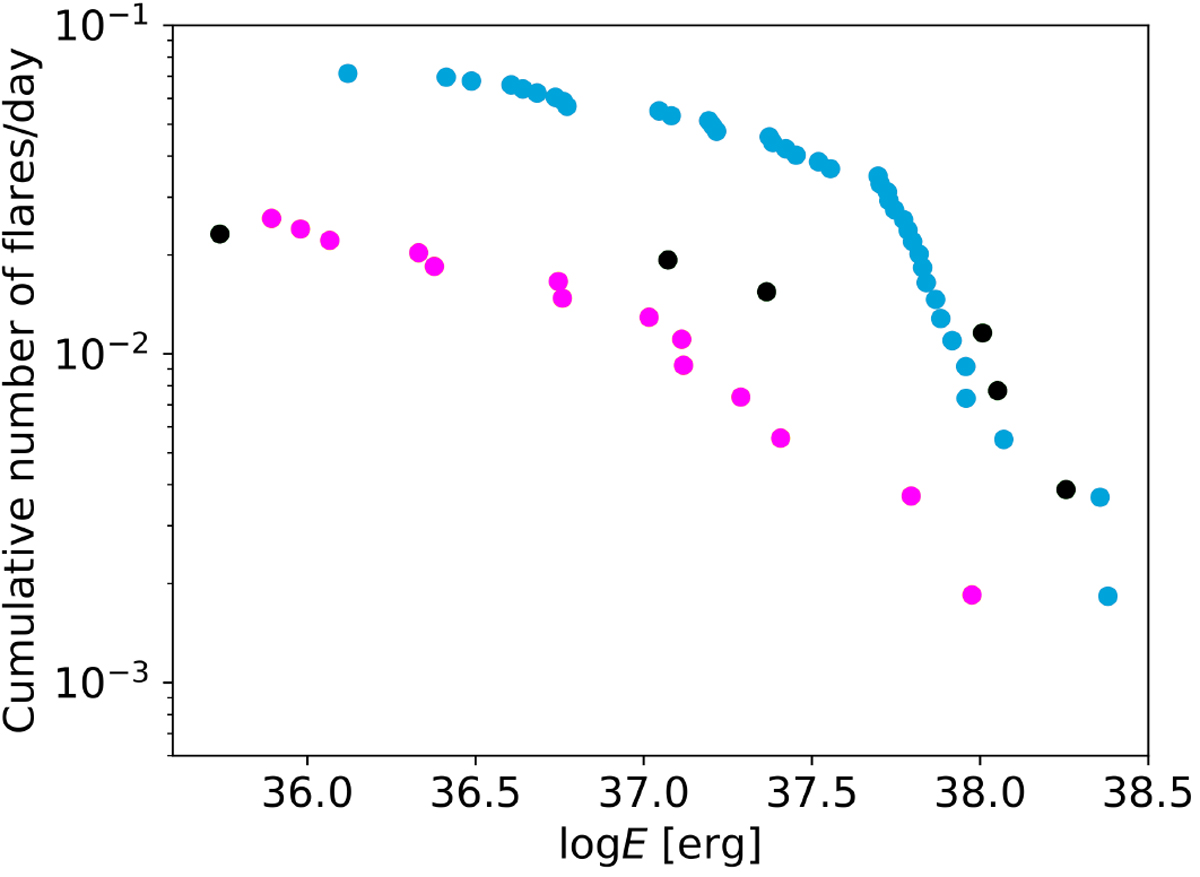
Cumulative flare-frequency diagram for three different phases of the Kepler light curve of KIC 2852961. Blue dots correspond to the FFD for the first period of the Kepler data until BJD = 700 (+2454833), when the rotational modulation shows large amplitudes. The FFD plotted in magenta represents the small amplitude period between BJD = 700 and 1300, while the third FFD in black corresponds to the third part of the light curve after BJD = 1300, when the amplitude increased again. See the text for an explanation.
Current usage metrics show cumulative count of Article Views (full-text article views including HTML views, PDF and ePub downloads, according to the available data) and Abstracts Views on Vision4Press platform.
Data correspond to usage on the plateform after 2015. The current usage metrics is available 48-96 hours after online publication and is updated daily on week days.
Initial download of the metrics may take a while.