Fig. 11
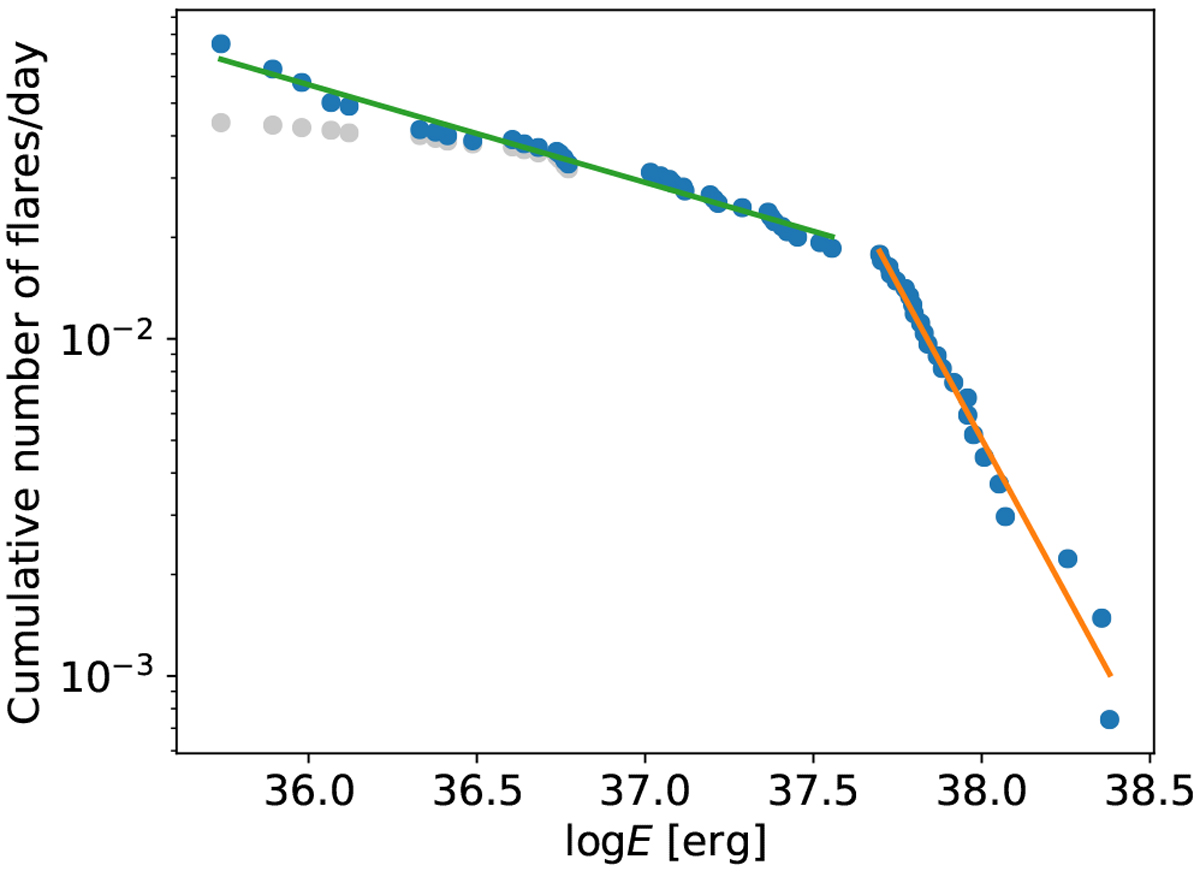
Detection bias-corrected cumulative flare-frequency diagram for KIC 2852961. The original detection-biased datapoints are plotted in gray; above them are the corrected points in blue. The fit to the lower energy range below the breakpoint (green line) yields α = 1.29 ± 0.02 parameter, while the fit for the high energy range above the breakpoint (orange line) gives α = 2.84 ± 0.06.
Current usage metrics show cumulative count of Article Views (full-text article views including HTML views, PDF and ePub downloads, according to the available data) and Abstracts Views on Vision4Press platform.
Data correspond to usage on the plateform after 2015. The current usage metrics is available 48-96 hours after online publication and is updated daily on week days.
Initial download of the metrics may take a while.