Fig. 8
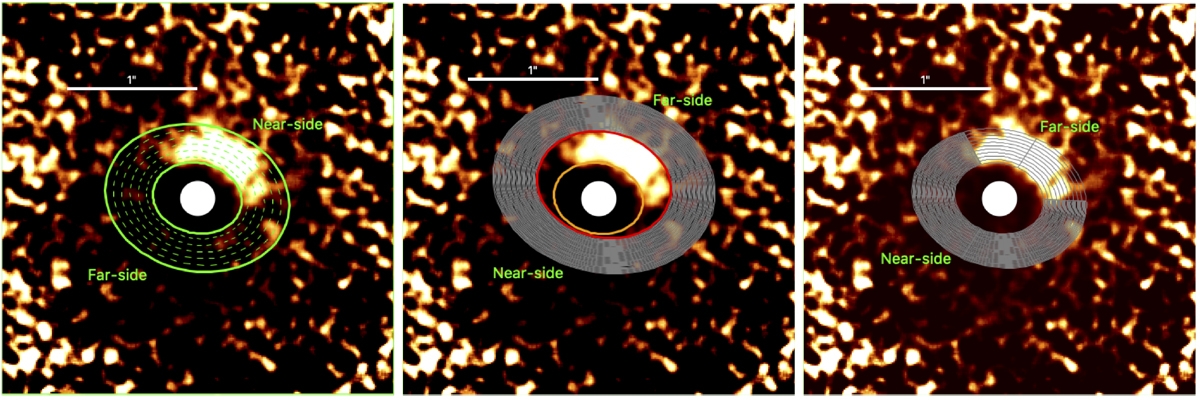
QΦ–r2 scaled image. The near and far-side of the disk are marked, north is up, east is left. Left panel: ellipses show the de-projected scattering surface. Near and far-side of the disk are defined according to the brightness asymmetries: brighter side closer to the observer. Middle panel: brighter side of the disk is coming from the illuminated wall of the outer disk. The orange and red ellipses mark the walls of the disk, the grey-shaded area marks the optically thick disk. Right panel: shadowed disk. The heavy-shaded grey area shows the portion of the disk that is shadowed due to the multiple inner rings misalignment. The light-shaded grey area marks the portion of the disk that is not shadowed, and is emitting in scattered light.
Current usage metrics show cumulative count of Article Views (full-text article views including HTML views, PDF and ePub downloads, according to the available data) and Abstracts Views on Vision4Press platform.
Data correspond to usage on the plateform after 2015. The current usage metrics is available 48-96 hours after online publication and is updated daily on week days.
Initial download of the metrics may take a while.