| Issue |
A&A
Volume 641, September 2020
|
|
|---|---|---|
| Article Number | A33 | |
| Number of page(s) | 10 | |
| Section | Interstellar and circumstellar matter | |
| DOI | https://doi.org/10.1051/0004-6361/202038337 | |
| Published online | 02 September 2020 | |
The circumstellar environment of EX Lupi: SPHERE and SINFONI views★,★★
1
INAF/Osservatorio Astronomico di Padova,
Vicolo dell’Osservatorio 5,
35122
Padova,
Italy
e-mail: elisabetta.rigliaco@inaf.it
2
Konkoly Observatory, Research Centre for Astronomy and Earth Sciences,
Konkoly-Thege Miklós út 15-17,
1121
Budapest, Hungary
3
Max Planck Institute for Astronomy,
Königstuhl 17,
69117
Heidelberg, Germany
4
ELTE Eötvös Loránd University, Institute of Physics,
Pázmány Péter sétány 1/A,
1117
Budapest, Hungary
5
Anton Pannekoek Institute for Astronomy, University of Amsterdam,
Science Park 904,
1098 XH
Amsterdam, The Netherlands
6
Leiden Observatory, Leiden University,
PO Box 9513,
2300 RA
Leiden, The Netherlands
7
European Southern Observatory,
Alonso de Córdova 3107, Casilla
19001,
Vitacura,
Santiago, Chile
8
INAF/Osservatorio Astrofisico di Arcetri,
Largo Enrico Fermi 5,
50125
Firenze, Italy
9
Max Planck Institute for Astronomy,
Königstuhl 17,
69117
Heidelberg, Germany
10
Univ. Grenoble Alpes, CNRS, IPAG,
38000
Grenoble, France
11
Núcleo de Astronomía, Facultad de Ingeniería y Ciencias, Universidad Diego Portales,
Av. Ejercito 441,
Santiago, Chile
12
Escuela de Ingeniería Industrial, Facultad de Ingeniería y Ciencias, Universidad Diego Portales,
Av. Ejercito 441,
Santiago, Chile
13
Aix-Marseille Université, CNRS, LAM (Laboratoire d’Astrophysique de Marseille) UMR 7326,
13388
Marseille, France
14
Aix-Marseille Université, CNRS, CNES, LAM,
Marseille, France
15
Geneva Observatory, University of Geneva,
Chemin des Mailettes 51,
1290 Versoix, Switzerland
Received:
4
May
2020
Accepted:
17
June
2020
Context. EX Lup is a well-studied T Tauri star that represents the prototype of young eruptive stars known as EXors. They are characterized by repetitive outbursts that are due to enhanced accretion from the circumstellar disk onto the star. In this paper, we analyze new adaptive optics imaging and spectroscopic observations to study EX Lup and its circumstellar environment in near-infrared in its quiescent phase.
Aims. We aim to provide a comprehensive understanding of the circumstellar environment around EX Lup in quiescence, building upon the vast store of data provided by the literature.
Methods. We observed EX Lup in quiescence with the high contrast imager SPHERE/IRDIS in the dual-beam polarimetric imaging mode to resolve the circumstellar environment in near-infrared scattered light. We complemented the data with earlier SINFONI spectroscopy, which was also taken in quiescence.
Results. We resolve, for the first time in scattered light, a compact feature around EX Lup azimuthally extending from ~280° to ~360° and radially extending from ~0.3′′ to ~0.55′′ in the plane of the disk. We explore two different scenarios for the detected emission. The first one accounts for the emission as coming from the brightened walls of the cavity excavated by the outflow whose presence was suggested by ALMA observations in the J = 3−2 line of 12CO. The second attributes the emission to an inclined disk. In this latter case, we detect, for the first time, a more extended circumstellar disk in scattered light, which shows that a region between ~10 and ~30 au is depleted of μm-size grains. We compare the J-, H-, and K-band spectra obtained with SINFONI in quiescence with the spectra taken during the outburst, showing that all the emission lines result from the episodic accretion event.
Conclusions. Based on the morphology analysis, we favor the scenario that assumes the scattered light is coming from a circumstellar disk rather than the outflow around EX Lup. We determine the origin of the observed feature as either coming from a continuous circumstellar disk with a cavity, from the illuminated wall of the outer disk, or from a shadowed disk. Moreover, we discuss the potential origins of the depleted region of μm-size grains, exploring the possibility that a sub-stellar companion may be the source of this feature.
Key words: stars: individual: EX Lup / stars: formation / protoplanetary disks / circumstellar matter / techniques: polarimetric / stars: pre-main sequence
Reduced images are only available at the CDS via anonymous ftp to cdsarc.u-strasbg.fr (130.79.128.5) or via http://cdsarc.u-strasbg.fr/viz-bin/cat/J/A+A/641/A33
© ESO 2020
1 Introduction
EXors (Herbig 1989) are a class of pre-main sequence eruptive stars which show bursts of short duration (months-one year) with a recurrence span of several years, exhibiting accretion rates of the order of 10−6 −10−7 M⊙ yr−1, and characterized by emission line spectra (e.g., Herbig 2008; Lorenzetti et al. 2009; Kóspál et al. 2011; Sicilia-Aguilar et al. 2012; Antoniucci et al. 2013). Studying this class of objects can provide useful insights into different open questions in the field of star formation. As an example, many protostars are observed to be less luminous than theoretically predicted (e.g., Dunham et al. 2013) and episodic accretion has been invoked as a solution to explain the luminosity problem. The understanding that all Sun-like young stars go through EXor-type outbursts at some point during their formation would clarify this aspect. Moreover, the physical mechanism causing the violent outbursts in EXors is still debated and EXors in quiescence are similar to regular Class II young stellar objects, with relatively low-mass disks (Liu et al. 2018). Analyzing this class of objects in greater detail can shed light on the mechanisms powering the episodic outbursts. These objects provide us with the possibility to study them both in quiescence and in outburst and, therefore, we can observe the effect of episodic accretion on the circumstellar disk; in particular, the planet-forming zone (e.g., the crystallization of silicate grains in EX Lup, Ábrahám et al. 2009). For these reasons, it is indispensable that we learn more about EXor circumstellar environments and, in particular, about the circumstellar disk of EX Lup, the prototype of the class.
EX Lup is a young (~2 Myr, Garufi et al. 2018) M0 T Tauri star with M* = 0.6 M⊙, at a distance of 157 ± 0.9 pc (Gaia Collaboration 2018; Bailer-Jones et al. 2018). It exhibited its largest outburst in 2008 (Jones 2008), brightening by about four magnitudes in visible light and triggering a series of multi-wavelengths observations. Its most recent light curve is shown in Ábrahám et al. (2019).
Spectralenergy distribution (SED) modeling of EX Lup (Sipos et al. 2009) shows evidence of the presence of IR excess, corresponding to a modestly flared dusty disk that extends from 0.2 up to 150 au from the central star with a total mass of 0.025 M⊙. This latter value is obtained on the basis of the assumption that the dust model contains only amorphous silicates of olivine and of pyroxene types with a mass ratio of 2:1. Moreover, we note that in this work, 150 au was taken as a fixed outer boundary for the calculations and not fitted. The observations did not constrain the outer radius of the disk. The innermost regions of the disk around EX Lup have been extensively studied (Grosso et al. 2010; Kóspál et al. 2014; Sicilia-Aguilar et al. 2015) and it has been suggested that infalling material reaches the star in hot spots via magnetospheric accretion. Based on hydrogen recombination lines, the mass accretion rate onto the star was ~4 × 10⁻¹⁰ M⊙ yr−1 before the outburst in 2008 (Sipos et al. 2009), increasing to 3 × 10⁻⁸–2 × 10⁻⁷ M⊙ yr−1 during the burst (Sicilia-Aguilar et al. 2012), and back down to ~10−10 M⊙ yr−1 afterwards (Juhász et al. 2012).
Improved studies on the structure and dynamics of the outer disk have only recently been initiated. Kóspál et al. (2016) used APEX to detect 12CO(3–2), 12CO(4–3), and 13CO(3–2) molecular emission from the Keplerian disk around EX Lup, without spatially resolving the disk. From the optically thin 13CO line, they derived a total disk mass of 2.3 × 10⁻⁴ M⊙, which is significantly lower than the one derived from the continuum data (assuming a canonical gas-to-dust ratio of 100) and SED-modeling. Hales et al. (2018) spatially resolved the dust emission from the disk in a 1.3 mm continuum and a more extended Keplerian gas disk in 12CO(2–1), 13CO(2–1), and C18 O(2–1) using ALMA observations. Moreover, they pointed out a more extended and non-Keplerian 12CO(2–1) emission interpreted as the interaction of a molecular outflow with remnant ambient material. Comparing the EX Lup 13CO/C18O line ratios to those based on the models of Williams & Best (2014), Hales et al. (2018) obtained a total disk mass in gas of 5.4 × 10⁻⁴ M⊙, and a total dust mass derived from the radiative transfer model fitting process of 1.0 × 10⁻⁴ M⊙, yielding to a gas-to-dust ratio of 5.4. Gas-to-dust ratios lower than the typical interstellar medium value of 100 seem to be common around disks in Lupus (Ansdell et al. 2016).
In the following, we present new observations of EX Lup taken with the Very Large Telescope at ESO’s Paranal Observatory in Chile. We employ polarimetric differential imaging (PDI) observations obtained with SPHERE/IRDIS in the H band to explore the circumstellar environment by tracing light scattered by the small (μm-sized) dust grains and J-, H-, and K bands medium-resolution near-infrared spectra acquired with SINFONI.
The paper is organized as follows: in Sect. 2, we introduce the new SPHERE/IRDIS and SINFONI observations and data reduction. In Sect. 3, we report the results and analysis of the data. We draw the two most plausible scenarios for the emission we detect in scattered light and we compare the quiescence versus outburst near-IR spectra. In Sect. 4, we discuss the results and summarize our conclusions.
2 Observations and data reduction
2.1 IRDIS polarimetric observations
EX Lup was observed with SPHERE (Spectro-Polarimetric High-contrast Exoplanet REsearch, Beuzit et al. 2019) as part of the ongoing SPHERE guaranteed time program to search for and characterize circumstellar disks. Observations were carried out with the InfraRed Dual-band Imager and Spectrograph (IRDIS; Dohlen et al. 2008) subsystem in dual-beam polarimetric imaging mode (DPI, de Boer et al. 2020; van Holstein et al. 2020) on May 16, 2017. The seeing during the night varied between 1.04′′ and 1.38′′, with airmass between 1.11 and 1.16 and coherence time (τ0) between 1.7 ms and 2.5 ms. IRDIS was used in DPI mode in H band, together with N_ALC_YJH_S coronagraph with Inner Working Angle (IWA) of 0.15′′. An integration time of 64 s was used for the individual frames in order to avoid detector saturation outside the coronagraph edge. The polarimetric cycles were taken by switching the half-wave plate (HWP) angles between 0°, 45°, 22.5° and 67.5°.
Data reduction was performed using the IRDAP1 pipeline (van Holstein et al. 2017, 2020). The pipeline first applies standard calibration to each individual image: dark subtraction, flat fielding, and bad-pixel correction. IRDAP then measures the precise position of the central star using the center calibration frames on the left and right sides of the detector. Then the two images in each datacube (NDIT = 2) are averaged to obtain one image for each HWP position of the polarimetric cycle. Finally, the two frames halves of the orthogonal polarization directions are split into two individual frames, corresponding to the parallel and perpendicular polarized beam. The two orthogonal polarization directions are needed to subtract the non-polarized light coming from the central star, leaving only the polarized light from the circumstellar material. To obtain the individual Q+, Q−, U+, and U− frames for each polarimetric cycle, IRDIS computes the single difference by subtracting the right frame from the left frame. The Stokes Q (and U) are then computed from the double difference using the Q+, Q−, U+, and U− frames. Subsequently, IRDAP uses a validated Mueller matrix model describing the telescope and instrument to correct the polarimetric images for instrumental polarization and crosstalk. IRDAP then measures and subtracts the polarization signal of the star from the resulting images. The subtraction of the stellar polarization signal removes anyspurious polarization or polarized astrophysical signal that comes either from the star or from the unresolved part of the circumstellar disk and affects the image of the disk that we want to investigate. The Stokes Q (and U) are then obtained by subtracting Q− (U−) from Q+ (U+). The final QΦ and UΦ images, as shown in Fig. 1 are obtained using the formulas given in de Boer et al. (2020) or using the formulas given in Schmid et al. (2006) for Qr and Ur, considering that QΦ = −Qr and UΦ = − Ur. The residualsignal in UΦ, close to the centre of the image, can be explained either by a suboptimal alignment of the coronagraphic frames or by multiple scattering in the inner disk.
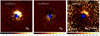 |
Fig. 1 Reduced SPHERE-IRDIS polarimetric QΦ, UΦ and QΦ –r2 scaled images. The coronagraph is marked with a blue circle. We assumed a conservative value for the coronagraph radius of 11 pixels, corresponding to 0.15′′. North is up,east to the left. |
2.2 SINFONI observations
Medium-resolution near-infrared imaging and spectroscopy of EX Lup has been obtained with the adaptive optics assisted integral field spectrograph SINFONI (Eisenhauer et al. 2003; Bonnet et al. 2004) during the quiescent phase, namely on the nights 1/2 September and 2/3 September 2012. The data belong to the program 089.C-0856(A) (P.I.: Kóspál) and cover the J- (1.10−1.45 μm), H- (1.45−1.85 μm) and K-band (1.93−2.45 μm) with spectral resolution of about 2000, 3000, and 4000, respectively. The images have a spatial scale of 12.5 mas pixel−1 and a field of view of 0.8′′ × 0.8′′. Data, using a similar instrument setup, were also acquired during the outburst in 2008 (Kóspál et al. 2011).
The data reduction was performed using the version 3.1.1 of the SINFONI pipeline, which performs dark-current subtraction, flat fielding, sky subtraction, and wavelength calibration. We first calculated the centroid for each image in the data cubes. Thenwe extracted spectra using an aperture with a radius of 5 pixels and a sky annulus between 20 and 30 pixels to calculate the flux of the star at each wavelength. Telluric absorption features were corrected fitting synthetic transmission spectra using the molecfit tool (Smette et al. 2015; Kausch et al. 2015) and the results were normalized by second-order polynomial in the line-free regions of the spectrum. Comparison of the spectra taken in the two different nights do not show any significant difference and, hence, they were averaged to increase the signal-to-noise ratio (S/N). The resulting spectra are shown in Figs. 2–4. The S/N is as high as 200 in the middle of the atmospheric windows and far from strong telluric bands (e.g., at 1.23–1.27 μm, or at 2.21–2.28 μm), 30–80 where there is strong telluric absorption (e.g., around 1.18 or 2.01 μm), and as low as 20 at the edges of the atmospheric windows (e.g., above 1.34 μm in the J band or above 2.40 μm in the K band).
3 Results and analysis
3.1 Results
The QΦ image reported in Fig. 1 shows an increase in the intensity distribution in the north-west direction. In order to account for the r−2 dependency of the stellar flux we show in right panel of Fig. 1 the QΦ image multiplied by the square of the separation from the central star, after accounting for the disk inclination. From this image it comes clear that the intensity distribution of the detected feature is asymmetrical, with a banana shape in the north-west side in the SPHERE image in polarized light. The feature extends radially from ~0.3′′ to ~0.55′′ and is not detected in the south-east side.
In Fig. 5, the top panel, we show the radial brightness profile after de-projecting the detected feature, using a position angle of 333°, as determined through the azimuthal profile (bottom panel of the same figure), and an inclination of 38° (Hales et al. 2018). The feature peaks at around 60 au, with a sharp inner edge at ~34 au and a shallower outer edge at ~88 au. There appears to be a plateau in the intensity profile between ~40 and ~54 au. The region between the coronagraph edge (~13 au) and the inner edge of the feature appears depleted of μm-size grains that produce the scattering emission. Figure 5, the bottom panel, we show the azimuthal profile of the de-projected QΦ image. The profile was derived between 34 and 88 au in radial direction. We measured the peak of the intensity and relative error in the azimuthal profile by performing a Monte Carlo approach: we added a normally distributed noise to the extracted azimuthal profile and as the peak value and error, we give the mean and standard deviation of the distribution of 100 such profiles, respectively. We find for the peak of the azimuthal profile a mean value of 333.1 ± 0.3°, and extends between ~280° and ~360°. If we assume this is the position angle of the semi-minor axis of the disk detected in scattered light, we can also mark the position on the semi-major axis, as reported in Fig. 5. For comparison, we show the signal obtained between 23–30 au, within the μm-size grains depleted region between the coronagraph edge and the inner edge of the feature. For comparison, we also show the azimuthal profile of the 12CO moment 0 map in the velocity range [−1.6,+1.7]. We can notice that even if the profile is more noisy (we do not include the error bars to improve the readability of the figure), there is a hint of a similar trend of the azimuthal profile between the 12CO and the scattered light. However, we must also notice that the azimuthal profile has been derived between 34 and 88 au in radial directions; such a range of values is optimized for the scattered light image rather than for the 12CO moment 0 map, which would require larger radial distances, as shown in Fig. 6.
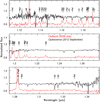 |
Fig. 2 Normalized SINFONI J-band spectrum of EX Lup in quiescence compared to the outburst. The position of the emission lines seen in the J-band spectrum taken during the outburst are marked (Kóspál et al. 2011). Many lines are seen in absorption rather than in emission, with the exception of the Paβ lines, which is still seen in emission. The outburst spectrum is shifted in intensity. |
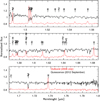 |
Fig. 3 Normalized SINFONI H-band spectrum of EX Lup in quiescence compared to the outburst. The position of the emission lines seen in the H-band spectrum taken during the outburst are marked (Kóspál et al. 2011). All the lines are seen in absorption rather than in emission. The outburst spectrum is shifted in intensity. |
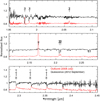 |
Fig. 4 Normalized SINFONI K-band spectrum of EX Lup in quiescence compared to the outburst. The position of the emission lines seen in the K-band spectrum taken during the outburst are marked (Kóspál et al. 2011). All the lines are seen in absorption rather than in emission. The CO overtone bandhead are also seen in absorption. The outburst spectrum is shifted in intensity. |
3.2 Analysis
In the following sections, we analyze the results. We compare the near-IR spectra of the outburst versus quiescence phase, then we discuss the emission detected in scattered light through two different scenarios. Firstly, we discuss the possibility that the emission is coming from μm-sized grains in a cavity carved by an outflow. Secondly, we discuss the possibility that the detected emission is coming from the outer part of the circumstellar disk. In order to put both these interpretations into context, we summarize and discuss the recent results found by Hales et al. (2018), which employ ALMA observations.
3.3 Outburst vs. post-outburst phase in the near-IR
In Figs. 2–4, we show the SINFONI spectra in J-, H- and K-band taken in 2012 during the quiescence phase. Contrary to the J, H, and K-band spectra of EX Lup during the outburst, the quiescent-phase spectra do not show the forest of emission lines and is dominated by absorption lines/bands typical of an M-type star. The most prominent emission comes from the Paβ line at 1.2821 μm (see Fig. 2), that is, however much weaker than observed during the outburst. The emission features detected by Kóspál et al. (2011) during the burst, and listed in their Table 1, are marked in the figures as vertical tick marks. Metallic lines such asNa, Ca, K, Fe, Ti, and Si absorption are numerous in M-type stars, and are often used for spectral type classification (Cushing et al. 2005). Atomic absorption lines, such as SI, MgI, AlI, highlighted in Figs. 2–4, which have also been observed by Sipos et al. (2009), are most likely to be photospheric in origin (see also Herbig et al. 2001). The comparison between the spectra taken during the burst and in the post-burst quiescent-phase highlights that there is no ejection activity around the star, as suggested by the absence of the [Feii] lines at 1.25 and 1.64 μm. We performed spectro-astrometry of the Paβ line in order to check if it might trace extended emitting material moving at different velocities. Paβ does not show any spectroastrometric signal, suggesting that it is most likely coming from very close to the star. The spectroastrometric signal in the Paβ line was found, instead, during the burst (Kóspál et al. 2011) and was likely indicating rotating material around the star.
The absence of emission lines in the SINFONI spectra, with the only exception in the Paβ line, suggests that all the lines detected during the burst are related to the accretion or the ejection of material immediately subsequent to the episodic accretion phenomenon. Paβ in the quiescent spectra might still trace accretion, as also found by Sipos et al. (2009), but orders of magnitude lower than in the outburst phase.
3.3.1 The disk and outflow as seen by ALMA
Hales et al. (2018) reported the first spatially resolved observation of the disk around EX Lup, obtained with ALMA at 0.3′′ resolution in 1.3 mm continuum emission and in the J = 2–1 spectral line of 12CO, 13CO, and C18 O. The compact dust continuum disk does not show indication of clumps or asymmetries in their data and is consistent with a characteristic radius of ~23 au. The elliptical Gaussian fitting of the compact continuum emission tracing the disk is consistent with PA of the disk of 63.1°±1.2° and disk inclination angle of 32.4° ± 0.9°. The 12CO emitting region extends up to ~1.3′′ from the stellar position and is notably more extended than the dust continuum and 13CO (~0.5′′) and C18O (~0.3′′) emitting regions. The intensity-weighted velocity fields obtained by Hales et al. (2018) for the three CO isotopologues show that the circumstellar gas is rotating. The line emission is consistent with Keplerian rotation at PA = 78° and disk inclination of 38° ± 4°. The gas characteristic radius is 75 au. The overall 12CO emission shows an additional velocity gradient perpendicular to the disk’s major axis consistent with the presence of a blueshifted outflow. In order to reconcile the low velocity of the gas (~2 km s−1) with respectto the systemic velocity, they attribute this blue emission to a molecular outflow interacting with the ambient material rather than to gas launched directly from the EXors source during the burst. However, they did not detect the redshifted counterpart of the outflow. According to their interpretation, the disk’s far side is in the north-west and the near side in the south-east, with the exposed surface rotating clockwise as seen by the observer, which is in agreement with the inner disk configuration proposed by Sicilia-Aguilar et al. (2012).
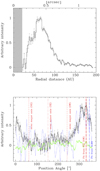 |
Fig. 5 Top panel: radial profile of the H-band deprojected QΦ image. The profile is normalized to the brightness peak of the disk. The gray area indicates the radius of the coronagraph. Bottom panel: black line shows the azimuthal profile of the QΦ image normalized to the unity. The PA of 330° as identified from the image is reported as red dashed thicker line. The PA of the outflow as identified from ALMA data is reported as a blue line and the blue-lighter line show the azimuthal profile as obtained from the 12CO moment 0 map in the velocity range [−1.6,+1.7], as identified by Hales et al. (2018). The lighter red lines mark position angles of the semi-major and semi-minor axis, as labeled. The green points mark the azimuthal profile within the μm-size grains depleted region. |
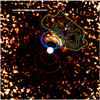 |
Fig. 6 QΦ–r2 scaled image. The blue/cyan and red ellipses highlight the approaching and receding cavity as carved if the emission in scattered light was due to the emission in the cavity walls as for the 12CO. We report in yellow the extended emission of the 12CO detected with ALMA. |
3.3.2 Outflow scenario
Considering the results obtained by Hales et al. (2018), here we explore the consistency between the extended emission of the 12CO seen in ALMA data and the emission seen in polarized light with SPHERE. We must remember that in the first case we are tracing gas and in the latter case we are tracing μm-sized grains. Several models assume that the radial distribution of μm-sized particles is expected to be similar to the gas distribution, while a large radial separation between the gas and dust is expected for mm-sized particles (e.g., Birnstiel et al. 2009; Pinilla et al. 2012, 2015) which may result in dissimilar observed structures at different wavelengths (e.g., HD 135344B – Garufi et al. 2013, HD 100546 – Pineda et al. 2019, and PDS70 – Keppler et al. 2019, among many others).
As shown in Fig. 6, the direction of the 12CO molecular outflow (whose contours are shown in yellow) is roughly consistent with the direction of the emission in polarized scattered light. If we were to trace the same brightened walls of the cavity excavated by the outflow as for the 12CO according toHales et al. (2018), we would be observing them in scattered light in the right direction. However, there are a few shortcomings when reconciling the two observations.
First of all, the 12CO, observed in July 2016 is farther away than the scattered light emission as observed in May 2017. This points out that the two images are tracing the same direction, but not the same gas coupled to the μm-size dust. In Fig. 6, we also show in blue and red the on-sky projection of the two cones that should represent the approaching and receding sides of the cavity carved into the medium by the outflow, according to the system’s geometry summarized in the previous section (i = 38° and PAdisk = 78°) and assuming the aperture of the scattered light emission is ~80° (as extending from ~280° up to ~360°). We can immediately notice that the μm-size dust detected in polarized light resides in a very confined area of the approaching cone, and none is detected in the receding cone. The system geometry implies that this emission observed in polarized light is coming from a region between ~30 and ~60 au in the vertical direction, above the disk’s plane. These values are given by the two cyan lines indicating the cone surface in Fig. 6. If we assume that the μm-size grains emitting in scattered light were lifted, for example, due to radiation pressure during the burst in 2008, or by a wide-angle wind, we obtain for the observed dust a velocity of ~30 km s−1, given as the velocity at which the dust has traveled between 30 and 60 au in the nine years between the burst and the SPHERE observations. This velocity is consistent with a low-velocity wind, but it is small if compared to the velocity observed in jets around young stars (e.g., Bally 2007; Hartigan et al. 2011; Nisini et al. 2018). The dust in the redshifted side of the outflow is not observed either because of an asymmetric or monopolar flow or due to the system’s geometry. Another possible reason might be that non-symmetric outflows in young sources can originate at larger radii, as observed for the Class I object BHB07-11 (Alves et al. 2017).
To find additional elements supporting the outflow scenario, we also looked at the SINFONI data discussed in Sect. 2.2 The most prominent emission that we see is the Paβ emission line. Paβ emission is a known tracer of accretion into young T Tauri stars (e.g., Muzerolle et al. 1998; Natta et al. 2002; Alcalá et al. 2017) but it has also been proposed as outflow indicator (e.g., Whelan et al. 2004). In Fig. 7, we show the maps of the Paβ line emission and of the adjacent continuum emission from the SINFONI data cube. The emission in Paβ appears centered at the same position as the stellar continuum, without any evidence of elongation or extension along the outflow direction, suggesting that it is consistent with an origin from close to the star, likely accretion onto the star, rather than an outflow or jet.
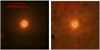 |
Fig. 7 Left panel: SINFONI continuum emission. The blue circle marks the position of the star. Right panel: SINFONI continuum-subtracted Paβ emission obtained mediating the channels around the Paβ emission linein J-band between 1.281 and 1.283 μm. The star’s position is marked with a blue circle. The emission appears as compact as the continuum emission and does not show evidence of outflowing material. |
3.3.3 Disk scenario
In this section, we take into account the possibility that the emission in scattered light is coming from the circumstellar disk around EX Lup. As discussed at the beginning of this section, the polarized light emission is asymmetric and shows a banana-shape, with enhanced intensity in the N-W direction.
Brightness asymmetries between the near and far side of the disk are often observed in scattered light from circumstellar disks (e.g., Garufi et al. 2020 and reference therein) due to the fact that in an inclined disk, the near and far side of the disk surface are seen under a different angle with respect to the star. Very small particles scatter light in all directions almost isotropically. When the particle size increases, the scattering becomes increasingly forward peaked (Min 2015). If the dust scatters anisotropically, a brightness asymmetry is observed due to the tendency of photons to be scattered by small angles (an effect yielding a forward-peaking scattering phase function; see, e.g., Stolker et al. 2016) with the near side of the disk appearing brighter than the far side of the disk. This would suggest that in the EX Lup the N-W direction represents the side of the disk closer to the observer, while the S-E is the further side, as shown in the right panel of Fig. 8. This interpretation is, however, in contrast to the findings obtained with ALMA by Hales et al. (2018), in which the disk is rotating clock-wise with the disk’s far side in the N-W. We note that polarized light emission above the 1−2% level was not detected by Kóspál et al. (2011) in the polarimetric images in H-band filter obtained with NACO in April 2008. This interpretation is, however, in contrast with the results coming from ALMA observations.
In order to reconcile the SPHERE data with the system’s geometry derived from the ALMA data (in which the brighter side corresponds to the disk’s further side) we have two different possibilities: either we are detecting scattered light from the inner edge of a ring or the near side of the disk is shadowed, and hence not visible in scattered light. In the first case, the scattering surface would be provided by the inner wall of the outer disk on the far side of the star, as for LkCa15 (Thalmann et al. 2010), a K5, ~1 M⊙ classical T Tauri star with an age of about 3–5 Myr (Simon et al. 2000). This interpretation requires a transitional disk with a gap through which we observe the illuminating surface. EX Lup does show evidence of a dust gap between 23 au (the coronagraph edge) and ~35 au when the sharp edge is seen in the radial profile. Moreover, the disk inclination of EX Lup (~38°) is not very different than the one estimated for LkCa15 (between 44°−50°; Thalmann et al. 2015, 2016; Oh et al. 2016). A sketch of this configuration is shown in the middle panel of Fig. 8, in which the grey area shows the circumstellar disk. As for LkCa15, the illuminated surface of the near-side wall is blocked by the bulk of the optically thick disk and the wall is high enough to cast the outer surface of the disk into shadow, suppressing a forward-scattering signature.
In the case where shadows hinder the detection of the near side of the disk in scattered light, we must assume warps and misalignment between the inner and outer disk. The presence of an inner disk is obvious both from the SED (Sipos et al. 2009) and from the accretion onto the star (Sicilia-Aguilar et al. 2012). Narrow shadow lanes (e.g., Pinilla et al. 2015; Stolker et al. 2016; Benisty et al. 2017; Casassus et al. 2018), as well as broad extended shadows (Benisty et al. 2018) or low-amplitude azimuthal variations (Debes et al. 2017; Poteet et al. 2018) are observed in scattered light. Of particular interest for this study is the case of HD 139614, the young (15.6 ± 4 Myr, Fairlamb et al. 2015) intermediate mass (1.5 ± 0.1 M⊙) A7V spectral-type star observed in scattered light by Muro-Arena et al. (2020). HD 139614 shows a very broad shadow region in the outer disk (30–200 au), between approximate position angles 0° and 240°, and the modeling of the disk suggests that the observed asymmetries can be reproduced with a two ring-shaped disk parts that are inclined with respect to each other by ~4° and also with respect to the outer disk. The case of EX Lup looks very similar to HD 139614, where the shadow cast upon the outer disk around EX Lup spans about 240 degrees azimuthally. Extensive modeling was performed by Muro-Arena et al. (2020) and given the similarity between the two cases, we do not deem it necessary to carry out similar computations that would be time-consuming and, rather, we may apply to the case of EX Lup the same conclusion drawn for HD 139614: multiple misaligned disk zones, potentially mimicking a warp with the possibility of a planetary mass companion in the disk, located on an inclined orbit, that would be responsible for such a feature and for the dust-depleted gap responsible for a dip in the SED. A sketch of this configuration is shown in the right panel of Fig. 8. The light-shaded grey area show the portion of the disk that is illuminated, while the heavy-shaded grey area the portion of the disk shadowed. The inner disk is not shown in this sketch and falls behind the coronagraph. No matter whether the scattering surface is coming from the inner wall of the outer disk or the non-shadowed surface of the circumstellar disk, we can make a few consideration that supports the disk scenario.
Using archival VLTI/MIDI observations, Ábrahám et al. (2019) derive values for the inner disk inclination and PA of 62 and 81
 , respectively. These values are in rough agreement, within the large error bars, with the estimates of disk inclination and PA derived by Hales et al. (2018) from ALMA data. Using the spherical law of cosines and the nominal values from VLTI/MIDI and ALMA for these two quantities, we estimated the misalignment of the inner disk (traced by MIDI) and the outer disk (traced by ALMA), which can span from ~2° up to ~40°. Another important limit to take into account is given by the inner disk flaring with respect to misalignment of the inner and outer disk. In fact, if the disks’ misalignment is larger than the inner disk flaring, light from the central star would still illuminate the outer disk in the direction where the PDI image does not show any signal. To check this aspect we considered the flaring of the disk as obtained by Sipos et al. (2009) from the modeling of the SED. They retrieve a modest flaring of the disk of ~6° semi-aperture angle. If we assume a multiple ring system, and the inner and outer disk are not much misaligned (less than a few degrees), the scenario that the configuration of the inner disk is casting a shadow on the outer disk is highly plausible.
Moreover, the comparison between the PA of the disk detected with SPHERE and ALMA points that the scattered light disk has a PA that is more consistent to the compact continuum emission detected with ALMA rather than to the more extended gaseous disk detected in CO. This is in agreement if we assume that the dusty disk is casting a shadow on the outer disk. Indeed, in this case, the PA dependence in scattered light would be dominated by the PA of the directly illuminated disk that is generating the shadow (hence, the dusty disk detected in continuum emission with ALMA).
 |
Fig. 8 QΦ–r2 scaled image. The near and far-side of the disk are marked, north is up, east is left. Left panel: ellipses show the de-projected scattering surface. Near and far-side of the disk are defined according to the brightness asymmetries: brighter side closer to the observer. Middle panel: brighter side of the disk is coming from the illuminated wall of the outer disk. The orange and red ellipses mark the walls of the disk, the grey-shaded area marks the optically thick disk. Right panel: shadowed disk. The heavy-shaded grey area shows the portion of the disk that is shadowed due to the multiple inner rings misalignment. The light-shaded grey area marks the portion of the disk that is not shadowed, and is emitting in scattered light. |
4 Discussion and conclusions
The new SPHERE data, acquired in polarimetric differential imaging in H-band, together with SINFONI data in J-, H- and K-band, allows us to investigate the nature of the polarized light-emitting region detected around EX Lup. Putting together results from the literature on this well-studied object with the new observations for this study, we discuss different aspects of this object.
We compared, for the first time, the near-IR spectra acquired in J-, H- and K-band with SINFONI in the quiescent-phase with the same data taken during the burst. We find that all the emission features observed during the burst have disappeared in the quiescent period, with the exception of the Paβ line, which appears less luminous. We conclude that there are no lines related to ejection activity in the quiescent phase, which supports the idea that the emission in scattered light is coming from a disk rather than an outflow.
Moreover, we outlined two different scenarios for the origin of the emission seen in scattered light. The first one analyzes the possibility that the detected scattered light, due to μm-size grains, is coming from the brightened walls of a polar cavity excavated by an outflow, as for the 12CO detected with ALMA. This scenario would support the recent finding obtained with ALMA by Hales et al. (2018). The second one analyzes the possibility that we are detecting a more extended circumstellar disk around EX Lup. Inthis case, EX Lup is a system with multiple rings, one causing the accretion, very close to the star that is behind the coronagraph in the SPHERE images, and one detected in scattered light extending from ~34 to ~88 au. In this latter scenario, we consider the case where the structure of the disk is similar to LkCa15 (Thalmann et al. 2010) and the scattering surface is given by the inner wall of the outer disk. We also consider the case in which the structure of the disk is similar to HD 139614 and the scattering surface is the portion of the disk that is not shadowed due to the misalignment between the inner and the outer disk. Even if none of the two scenarios can be totally confirmed or excluded, we favor the latter, namely, the one in which the PA of the continuum disk as detected by ALMA is the same as the PA of the scattered light disk as detected with IRDIS-PDI. We are aware that ALMA and PDI images trace very different regions of the disk, with the first one tracing mainly dust settled in the midplane and the second one tracing the surface layers of the circumstellar disk.
In the following, we discuss the potential source of the depleted region in μm-size grains that we see between the coronagraph edge and ~30 au. The continuum emission at 1.3 mm is detected with ALMA up to 23 au from the central star. On the contrary, between 30 and 40 au, we notice a steep increase in the intensity in the radial profile of the IRDIS-PDI image, which is often associated with the presence of a disk or ring.
Photoevaporation due to high-energy radiation from the central star can open gaps and cavities in circumstellar disks (e.g., Alexander et al. 2014; Ercolano & Pascucci 2017). Ercolano et al. 2018 showed that X-ray photoevaporation in transitional disks with modest gas-phase depletion of carbon and oxygen can explain a large diversity of accretion rates and cavity sizes that can extend up to a few tens of au as the one observed in EX Lup. The process of photoevaporation was already invoked by Sipos et al. (2009) to explain the inner-disk hole detected up to 0.2 au, very close to the central star. Particles trapping may also be the origin of structures, such as gaps and cavity, in circumstellar disks. The trapping in many cases is due to a massive planet filtering dust particles and trapping mainly the mm-sized particles in the outer pressure bump formed at the edge of the planetary gap (e.g., Rice et al. 2006; Zhu 2011; Pinilla et al. 2012 among many others). Recently, Owen & Kollmeier (2019) invoked a new mechanism that combines particles trapping and photoevaporation. The mechanism focuses on the removal of dust from the pressure trap that is created when photoevaporation opens a cavity in an evolved protoplanetary disk. Radiation pressure can efficiently remove small particles from the surface layers of the disk in the vicinity of the pressure trap: large dust particles settle towards the mid-plane and the center of the pressure trap, whereas small particles which are created by the fragmentation of the large particles are lofted above the photosphere. The small particles above the photosphere are driven outwards by radiation pressure and the small particles are then replaced by the collisional fragmentation of larger particles in the mid-plane. The radiation-pressure clear-out of a dusty photoevaporating disk as proposed by Owen & Kollmeier (2019) might simultaneously explain the ALMA and PDI observations.
The presence of a companion around EX Lup has been widely investigated over the years, particularly in the context of explaining the outbursting behavior of the star. Kóspál et al. (2014) proposed the presence of an hypothetical companion to account for the periodic variations in the radial velocities of the photospheric absorption lines seen in the spectra of EX Lup. According to their studies, the radial velocity (RV) signal could be fitted with a companion of msini = 14.7 MJup (~0.014 M⊙) assuming aninclination of 38° located at 0.06 au from the primary) in a 7.417 d period eccentric orbit around EX Lup. Ghez et al. (1997) conducted a multiplicity study in the binary star separation range between 0.1′′ and 12′′, and detected no companion around EX Lup in K-band. Bailey (1998) employed spectro-astrometry to detect the signal of a companion around EX Lup with an accuracy of 70 mas if the spectra of the two stars were very similar or if one was much fainter. Also in this case, no signal was detected. If we interpret the depleted area in the IRDIS-PDI observations acquired for EX Lup as carved out by a companion (sub-stellar in mass), this companion would also be the most likely cause of the inner and outer disk misalignment.
The presence of an innermost companion carving the gap between the rings, which are hidden behind the coronagraph in the IRDIS/SPHERE image, is most likely to also be the cause of the rings’ misalignment. A monitoring of EX Lup with angular differential imaging observation could certainly help in detecting the possible companion that has been so widely suggested in the literature.
Acknowledgements
E.R. is supported by the European Unions Horizon 2020 research and innovation programme under the Marie Skłodowska-Curie grant agreement No 664931. E.R. and S.D. acknowledge financial support from the ASI-INAF agreement n.2018-16-HH.0. This work has been supported by the project PRIN INAF 2016 The Cradle of Life – GENESIS-SKA (General Conditions in Early Planetary Systems for the rise of life with SKA) and by the “Progetti Premiali” funding scheme of the Italian Ministry of Education, University, and Research. This project has received funding from the European Research Council (ERC) under the European Union’s Horizon 2020 research and innovation programme under grant agreement No 716155. T.H. acknowledges support from the European Research Council under the Horizon 2020 Framework Program via the ERC Advanced Grant Origins 83 24 28. SPHERE is an instrument designed and built by a consortium consisting of IPAG (Grenoble, France), MPIA (Heidelberg, Germany), LAM (Marseille, France), LESIA (Paris, France), Laboratoire Lagrange (Nice, France), INAF Osservatorio Astronomico di Padova (Italy), Observatoire de Geneve (Switzerland), ETH Zurich (Switzerland), NOVA (Netherlands), ONERA (France) and ASTRON (Netherlands) in collaboration with ESO. SPHERE was funded by ESO, with additional contributions from CNRS (France), MPIA (Germany), INAF (Italy), FINES (Switzerland) and NOVA (Netherlands). SPHERE also received funding from the European Commission Sixth and Seventh Framework Programmes as part of the Optical Infrared Coordination Network for Astronomy (OPTICON) under grant number RII3-Ct-2004-001566 for FP6 (2004-2008), grant number 226604 for FP7 (2009-2012), and grant number 312430 for FP7 (2013-2016).
References
- Ábrahám, P., Juhász, A., Dullemond, C. P., et al. 2009, Nature, 459, 224 [Google Scholar]
- Ábrahám, P., Chen, L., Kóspál, Á., et al. 2019, ApJ, 887, 156 [Google Scholar]
- Alcalá, J. M., Manara, C. F., Natta, A., et al. 2017, A&A, 600, A20 [NASA ADS] [CrossRef] [EDP Sciences] [Google Scholar]
- Alexander, R., Pascucci, I., Andrews, S., Armitage, P., & Cieza, L. 2014, in Protostars and Planets VI, eds. H. Beuther, R. S. Klessen, C. P. Dullemond, & T. Henning (Tucson, AZ: University of Arizona Press), 475 [Google Scholar]
- Alves, F. O., Girart, J. M., Caselli, P., et al. 2017, A&A, 603, L3 [NASA ADS] [CrossRef] [EDP Sciences] [Google Scholar]
- Ansdell, M., Williams, J. P., van der Marel, N., et al. 2016, ApJ, 828, 46 [Google Scholar]
- Antoniucci, S., Giannini, T., & Lorenzetti, D. 2013, New Astron., 23, 98 [Google Scholar]
- Bailer-Jones, C. A. L., Rybizki, J., Fouesneau, M., Mantelet, G., & Andrae, R. 2018, AJ, 156, 58 [NASA ADS] [CrossRef] [Google Scholar]
- Bailey, J. 1998, MNRAS, 301, 161 [Google Scholar]
- Bally, J. 2007, Ap&SS, 311, 15 [Google Scholar]
- Benisty, M., Stolker, T., Pohl, A., et al. 2017, A&A, 597, A42 [NASA ADS] [CrossRef] [EDP Sciences] [Google Scholar]
- Benisty, M., Juhász, A., Facchini, S., et al. 2018, A&A, 619, A171 [NASA ADS] [CrossRef] [EDP Sciences] [Google Scholar]
- Beuzit, J. L., Vigan, A., Mouillet, D., et al. 2019, A&A, 631, A155 [NASA ADS] [CrossRef] [EDP Sciences] [Google Scholar]
- Birnstiel, T., Dullemond, C. P., & Brauer, F. 2009, A&A, 503, L5 [NASA ADS] [CrossRef] [EDP Sciences] [Google Scholar]
- Bonnet, H., Conzelmann, R., Delabre, B., et al. 2004, SPIE Conf. Ser., 5490, 130 [Google Scholar]
- Casassus, S., Avenhaus, H., Pérez, S., et al. 2018, MNRAS, 477, 5104 [NASA ADS] [CrossRef] [Google Scholar]
- Cushing, M. C., Rayner, J. T., & Vacca, W. D. 2005, ApJ, 623, 1115 [NASA ADS] [CrossRef] [Google Scholar]
- Debes, J. H., Poteet, C. A., Jang-Condell, H., et al. 2017, ApJ, 835, 205 [NASA ADS] [CrossRef] [Google Scholar]
- de Boer, J., Langlois, M., van Holstein, R. G., et al. 2020, A&A, 633, A63 [NASA ADS] [CrossRef] [EDP Sciences] [Google Scholar]
- Dohlen, K., Langlois, M., Saisse, M., et al. 2008, SPIE Conf. Ser., 7014, 70143L [Google Scholar]
- Dunham, M. M., Arce, H. G., Allen, L. E., et al. 2013, AJ, 145, 94 [Google Scholar]
- Eisenhauer, F., Abuter, R., Bickert, K., et al. 2003, SPIE Conf. Ser., 4841, 1548 [Google Scholar]
- Ercolano, B., & Pascucci, I. 2017, R. Soc. Open Sci., 4, 170114 [Google Scholar]
- Ercolano, B., Weber, M. L., & Owen, J. E. 2018, MNRAS, 473, L64 [Google Scholar]
- Fairlamb, J. R., Oudmaijer, R. D., Mendigutía, I., Ilee, J. D., & van den Ancker, M. E. 2015, MNRAS, 453, 976 [NASA ADS] [CrossRef] [Google Scholar]
- Gaia Collaboration 2018, VizieR Online Data Catalog: I/345 [Google Scholar]
- Garufi, A., Quanz, S. P., Avenhaus, H., et al. 2013, A&A, 560, A105 [NASA ADS] [CrossRef] [EDP Sciences] [Google Scholar]
- Garufi, A., Benisty, M., Pinilla, P., et al. 2018, A&A, 620, A94 [NASA ADS] [CrossRef] [EDP Sciences] [Google Scholar]
- Garufi, A., Avenhaus, H., Pérez, S., et al. 2020, A&A, 633, A82 [CrossRef] [EDP Sciences] [Google Scholar]
- Ghez, A. M., McCarthy, D. W., Patience, J. L., & Beck, T. L. 1997, ApJ, 481, 378 [Google Scholar]
- Grosso, N., Hamaguchi, K., Kastner, J. H., Richmond, M. W., & Weintraub, D. A. 2010, A&A, 522, A56 [NASA ADS] [CrossRef] [EDP Sciences] [Google Scholar]
- Hales, A. S., Pérez, S., Saito, M., et al. 2018, ApJ, 859, 111 [Google Scholar]
- Hartigan, P., Frank, A., Foster, J. M., et al. 2011, ApJ, 736, 29 [Google Scholar]
- Herbig, G. H. 1989, European Southern Observatory Conference and Workshop Proceedings, 33, 233 [Google Scholar]
- Herbig, G. H. 2008, AJ, 135, 637 [Google Scholar]
- Herbig, G. H., Aspin, C., Gilmore, A. C., Imhoff, C. L., & Jones, A. F. 2001, PASP, 113, 1547 [Google Scholar]
- Jones, A. F. A. L. 2008, CBET, 1217, 1 [Google Scholar]
- Juhász, A., Dullemond, C. P., van Boekel, R., et al. 2012, ApJ, 744, 118 [Google Scholar]
- Kausch, W., Noll, S., Smette, A., et al. 2015, A&A, 576, A78 [NASA ADS] [CrossRef] [EDP Sciences] [Google Scholar]
- Keppler, M., Teague, R., Bae, J., et al. 2019, A&A, 625, A118 [NASA ADS] [CrossRef] [EDP Sciences] [Google Scholar]
- Kóspál, Á., Ábrahám, P., Goto, M., et al. 2011, ApJ, 736, 72 [NASA ADS] [CrossRef] [Google Scholar]
- Kóspál, Á., Mohler-Fischer, M., Sicilia-Aguilar, A., et al. 2014, A&A, 561, A61 [NASA ADS] [CrossRef] [EDP Sciences] [Google Scholar]
- Kóspál, Á., Ábrahám, P., Csengeri, T., et al. 2016, ApJ, 821, L4 [Google Scholar]
- Liu, H. B., Dunham, M. M., Pascucci, I., et al. 2018, A&A, 612, A54 [NASA ADS] [CrossRef] [EDP Sciences] [Google Scholar]
- Lorenzetti, D., Larionov, V. M., Giannini, T., et al. 2009, ApJ, 693, 1056 [NASA ADS] [CrossRef] [Google Scholar]
- Min, M. 2015, Eur. Phys. J. Web Conf., 102, 00016 [Google Scholar]
- Muro-Arena, G. A., Benisty, M., Ginski, C., et al. 2020, A&A, 635, A121 [NASA ADS] [CrossRef] [EDP Sciences] [Google Scholar]
- Muzerolle, J., Hartmann, L., & Calvet, N. 1998, AJ, 116, 455 [Google Scholar]
- Natta, A., Testi, L., Comerón, F., et al. 2002, A&A, 393, 597 [NASA ADS] [CrossRef] [EDP Sciences] [Google Scholar]
- Nisini, B., Antoniucci, S., Alcalá, J. M., et al. 2018, A&A, 609, A87 [EDP Sciences] [Google Scholar]
- Oh, D., Hashimoto, J., Tamura, M., et al. 2016, PASJ, 68, L3 [Google Scholar]
- Owen, J. E., & Kollmeier, J. A. 2019, MNRAS, 487, 3702 [Google Scholar]
- Pineda, J. E., Szulágyi, J., Quanz, S. P., et al. 2019, ApJ, 871, 48 [Google Scholar]
- Pinilla, P., Benisty, M., & Birnstiel, T. 2012, A&A, 545, A81 [NASA ADS] [CrossRef] [EDP Sciences] [Google Scholar]
- Pinilla, P., de Juan Ovelar, M., Ataiee, S., et al. 2015, A&A, 573, A9 [NASA ADS] [CrossRef] [EDP Sciences] [Google Scholar]
- Poteet, C. A., Chen, C. H., Hines, D. C., et al. 2018, ApJ, 860, 115 [Google Scholar]
- Rice, W. K. M., Armitage, P. J., Wood, K., & Lodato, G. 2006, MNRAS, 373, 1619 [Google Scholar]
- Schmid, H. M., Joos, F., & Tschan, D. 2006, A&A, 452, 657 [NASA ADS] [CrossRef] [EDP Sciences] [Google Scholar]
- Sicilia-Aguilar, A., Kóspál, Á., Setiawan, J., et al. 2012, A&A, 544, A93 [NASA ADS] [CrossRef] [EDP Sciences] [Google Scholar]
- Sicilia-Aguilar, A., Fang, M., Roccatagliata, V., et al. 2015, A&A, 580, A82 [NASA ADS] [CrossRef] [EDP Sciences] [Google Scholar]
- Simon, M., Dutrey, A., & Guilloteau, S. 2000, ApJ, 545, 1034 [NASA ADS] [CrossRef] [Google Scholar]
- Sipos, N., Ábrahám, P., Acosta-Pulido, J., et al. 2009, A&A, 507, 881 [NASA ADS] [CrossRef] [EDP Sciences] [Google Scholar]
- Smette, A., Sana, H., Noll, S., et al. 2015, A&A, 576, A77 [NASA ADS] [CrossRef] [EDP Sciences] [Google Scholar]
- Stolker, T., Dominik, C., Avenhaus, H., et al. 2016, A&A, 595, A113 [NASA ADS] [CrossRef] [EDP Sciences] [Google Scholar]
- Thalmann, C., Grady, C. A., Goto, M., et al. 2010, ApJ, 718, L87 [Google Scholar]
- Thalmann, C., Mulders, G. D., Janson, M., et al. 2015, ApJ, 808, L41 [Google Scholar]
- Thalmann, C., Janson, M., Garufi, A., et al. 2016, ApJ, 828, L17 [Google Scholar]
- van Holstein, R. G., Snik, F., Girard, J. H., et al. 2017, SPIE Conf. Ser., 10400, 1040015 [Google Scholar]
- van Holstein, R. G., Girard, J. H., de Boer, J., et al. 2020, A&A, 633, A64 [NASA ADS] [CrossRef] [EDP Sciences] [Google Scholar]
- Whelan, E. T., Ray, T. P., & Davis, C. J. 2004, A&A, 417, 247 [NASA ADS] [CrossRef] [EDP Sciences] [Google Scholar]
- Williams, J. P., & Best, W. M. J. 2014, ApJ, 788, 59 [NASA ADS] [CrossRef] [Google Scholar]
- Zhu, Z. 2011, PhD thesis, University of Michigan, USA [Google Scholar]
All Figures
|
Fig. 1 Reduced SPHERE-IRDIS polarimetric QΦ, UΦ and QΦ –r2 scaled images. The coronagraph is marked with a blue circle. We assumed a conservative value for the coronagraph radius of 11 pixels, corresponding to 0.15′′. North is up,east to the left. |
| In the text | |
|
Fig. 2 Normalized SINFONI J-band spectrum of EX Lup in quiescence compared to the outburst. The position of the emission lines seen in the J-band spectrum taken during the outburst are marked (Kóspál et al. 2011). Many lines are seen in absorption rather than in emission, with the exception of the Paβ lines, which is still seen in emission. The outburst spectrum is shifted in intensity. |
| In the text | |
|
Fig. 3 Normalized SINFONI H-band spectrum of EX Lup in quiescence compared to the outburst. The position of the emission lines seen in the H-band spectrum taken during the outburst are marked (Kóspál et al. 2011). All the lines are seen in absorption rather than in emission. The outburst spectrum is shifted in intensity. |
| In the text | |
|
Fig. 4 Normalized SINFONI K-band spectrum of EX Lup in quiescence compared to the outburst. The position of the emission lines seen in the K-band spectrum taken during the outburst are marked (Kóspál et al. 2011). All the lines are seen in absorption rather than in emission. The CO overtone bandhead are also seen in absorption. The outburst spectrum is shifted in intensity. |
| In the text | |
|
Fig. 5 Top panel: radial profile of the H-band deprojected QΦ image. The profile is normalized to the brightness peak of the disk. The gray area indicates the radius of the coronagraph. Bottom panel: black line shows the azimuthal profile of the QΦ image normalized to the unity. The PA of 330° as identified from the image is reported as red dashed thicker line. The PA of the outflow as identified from ALMA data is reported as a blue line and the blue-lighter line show the azimuthal profile as obtained from the 12CO moment 0 map in the velocity range [−1.6,+1.7], as identified by Hales et al. (2018). The lighter red lines mark position angles of the semi-major and semi-minor axis, as labeled. The green points mark the azimuthal profile within the μm-size grains depleted region. |
| In the text | |
|
Fig. 6 QΦ–r2 scaled image. The blue/cyan and red ellipses highlight the approaching and receding cavity as carved if the emission in scattered light was due to the emission in the cavity walls as for the 12CO. We report in yellow the extended emission of the 12CO detected with ALMA. |
| In the text | |
|
Fig. 7 Left panel: SINFONI continuum emission. The blue circle marks the position of the star. Right panel: SINFONI continuum-subtracted Paβ emission obtained mediating the channels around the Paβ emission linein J-band between 1.281 and 1.283 μm. The star’s position is marked with a blue circle. The emission appears as compact as the continuum emission and does not show evidence of outflowing material. |
| In the text | |
|
Fig. 8 QΦ–r2 scaled image. The near and far-side of the disk are marked, north is up, east is left. Left panel: ellipses show the de-projected scattering surface. Near and far-side of the disk are defined according to the brightness asymmetries: brighter side closer to the observer. Middle panel: brighter side of the disk is coming from the illuminated wall of the outer disk. The orange and red ellipses mark the walls of the disk, the grey-shaded area marks the optically thick disk. Right panel: shadowed disk. The heavy-shaded grey area shows the portion of the disk that is shadowed due to the multiple inner rings misalignment. The light-shaded grey area marks the portion of the disk that is not shadowed, and is emitting in scattered light. |
| In the text | |
Current usage metrics show cumulative count of Article Views (full-text article views including HTML views, PDF and ePub downloads, according to the available data) and Abstracts Views on Vision4Press platform.
Data correspond to usage on the plateform after 2015. The current usage metrics is available 48-96 hours after online publication and is updated daily on week days.
Initial download of the metrics may take a while.