Fig. 5
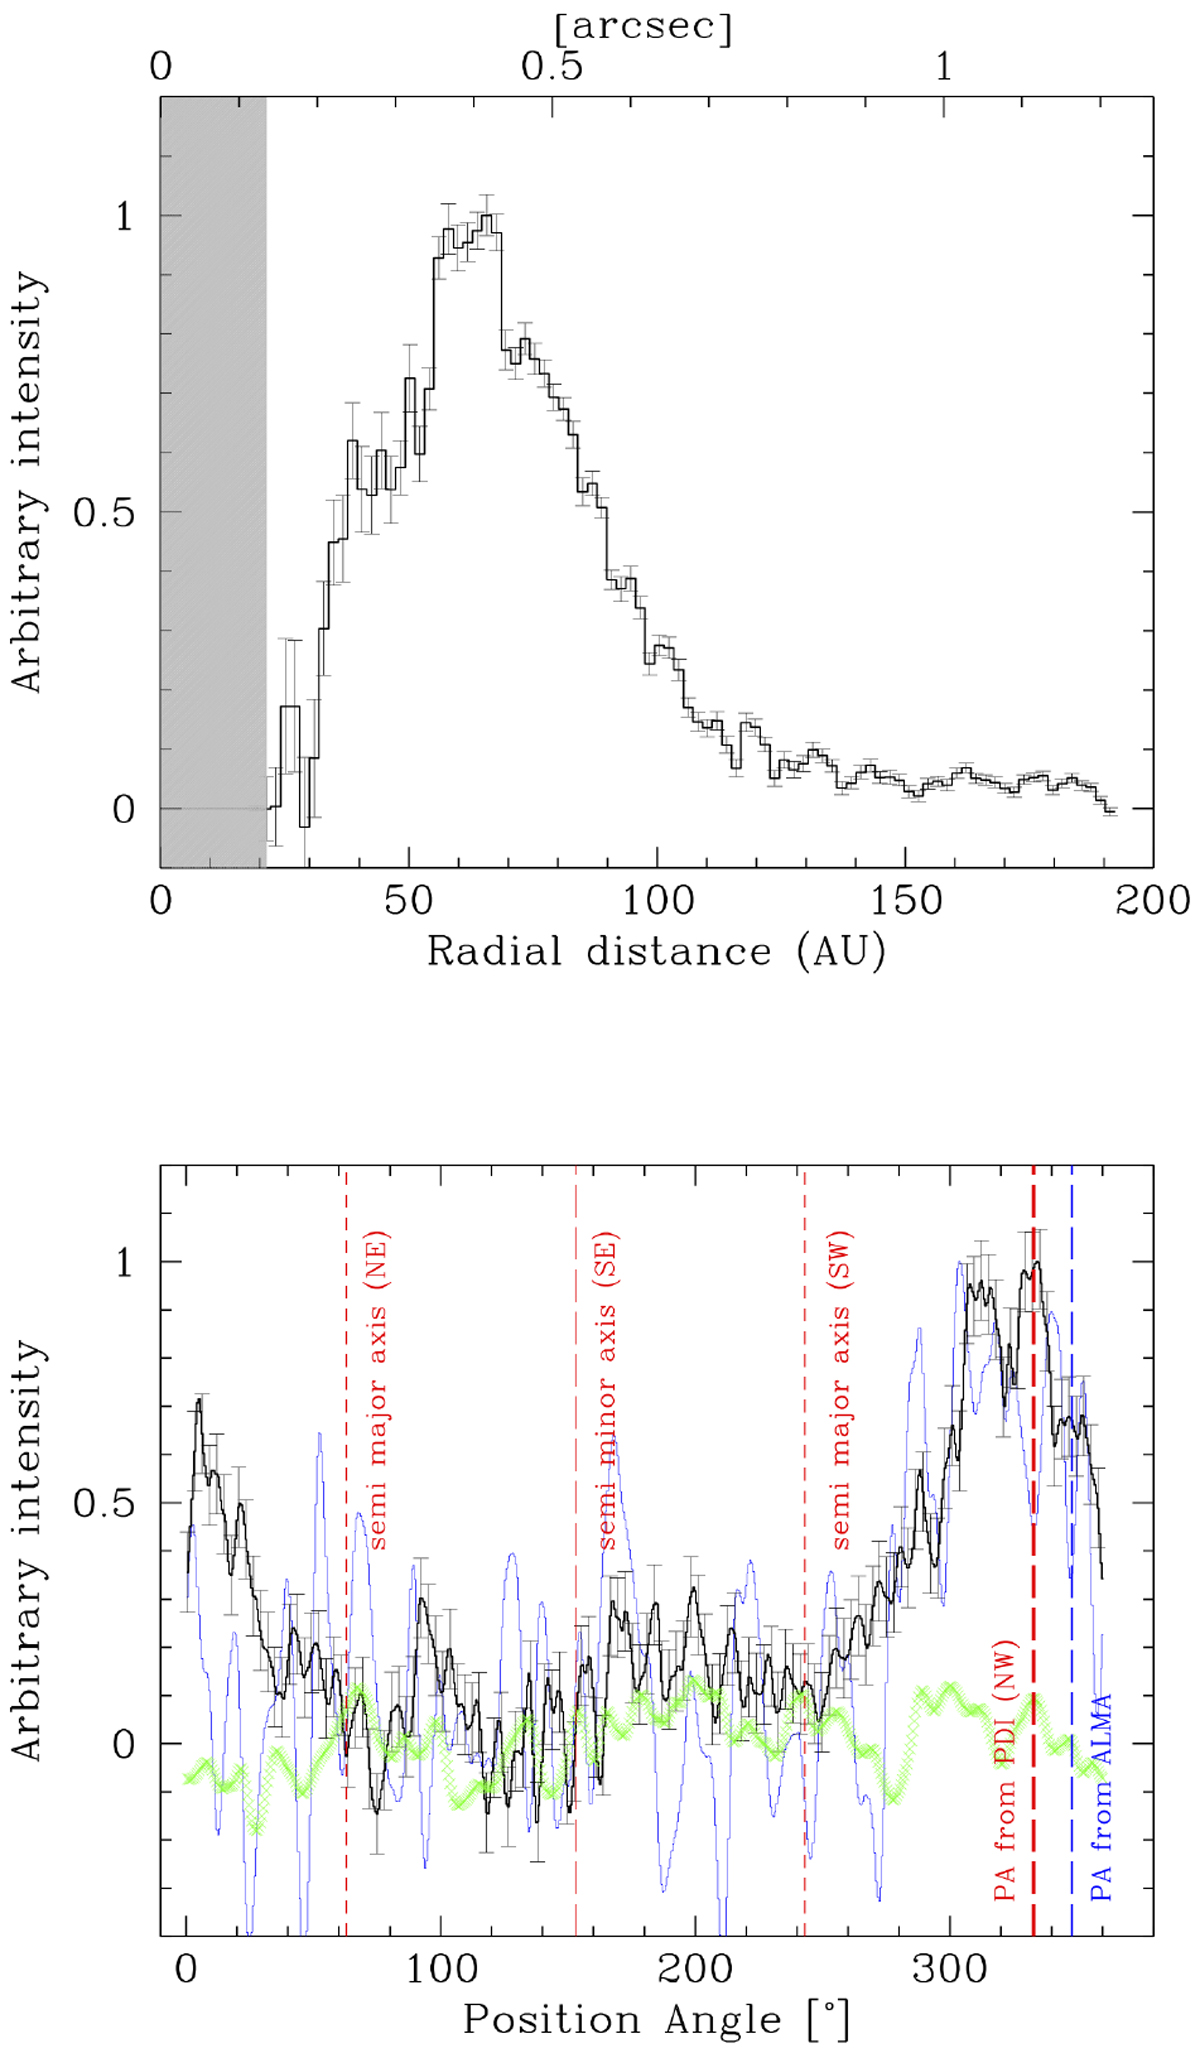
Top panel: radial profile of the H-band deprojected QΦ image. The profile is normalized to the brightness peak of the disk. The gray area indicates the radius of the coronagraph. Bottom panel: black line shows the azimuthal profile of the QΦ image normalized to the unity. The PA of 330° as identified from the image is reported as red dashed thicker line. The PA of the outflow as identified from ALMA data is reported as a blue line and the blue-lighter line show the azimuthal profile as obtained from the 12CO moment 0 map in the velocity range [−1.6,+1.7], as identified by Hales et al. (2018). The lighter red lines mark position angles of the semi-major and semi-minor axis, as labeled. The green points mark the azimuthal profile within the μm-size grains depleted region.
Current usage metrics show cumulative count of Article Views (full-text article views including HTML views, PDF and ePub downloads, according to the available data) and Abstracts Views on Vision4Press platform.
Data correspond to usage on the plateform after 2015. The current usage metrics is available 48-96 hours after online publication and is updated daily on week days.
Initial download of the metrics may take a while.