Fig. C.1.
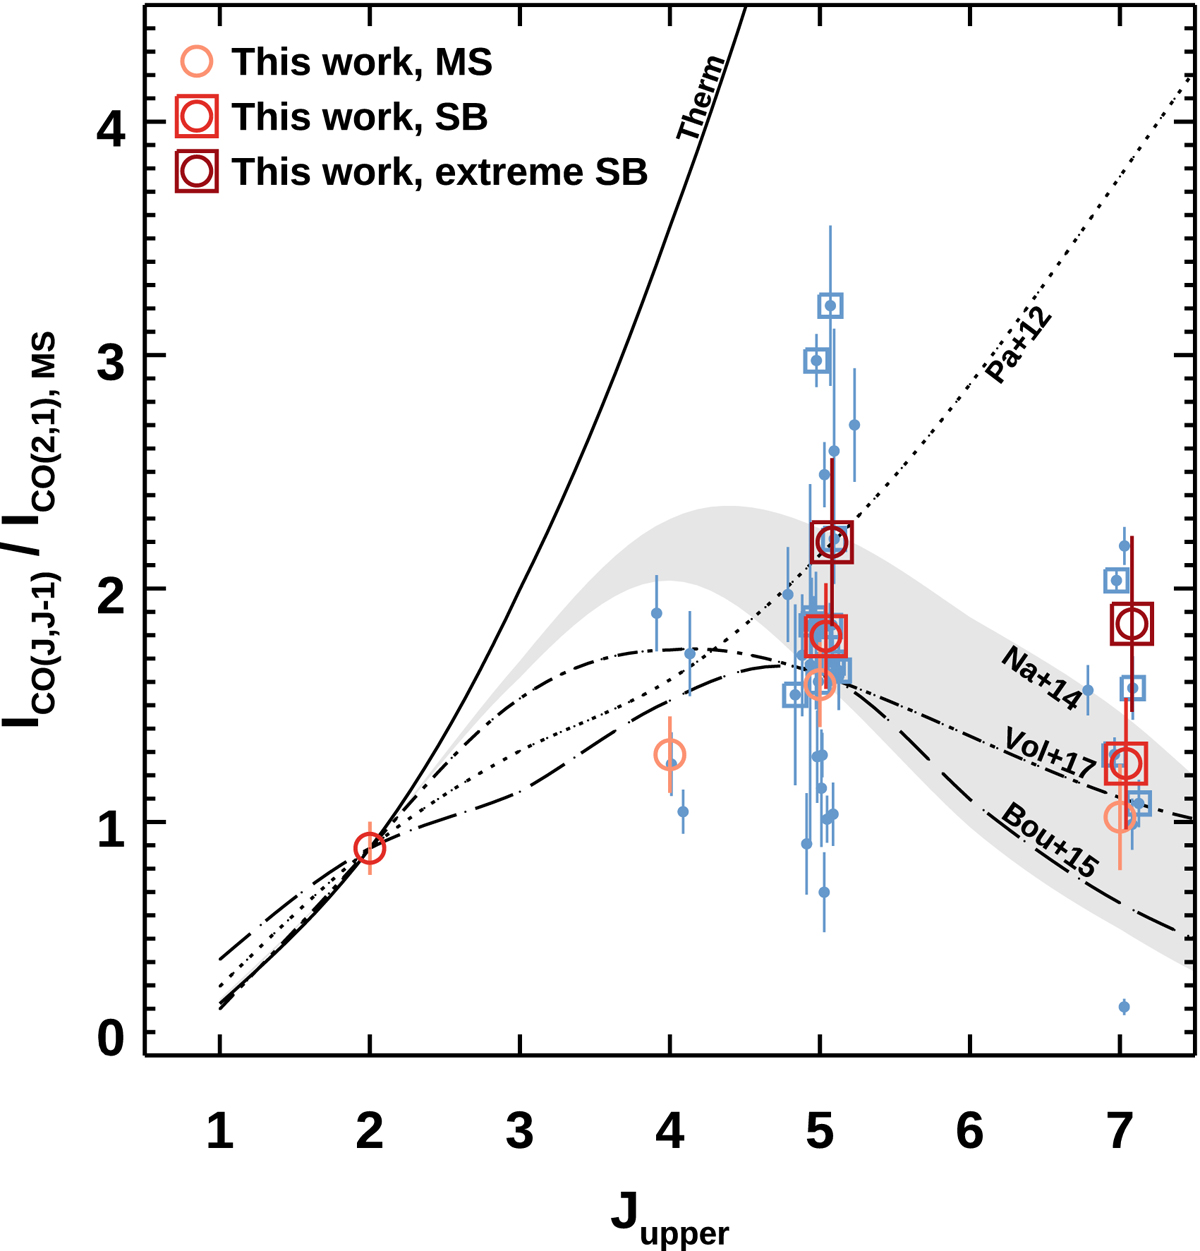
Diversity of CO SLEDs for main-sequence and starburst galaxies. Blue filled circles and open squares indicate the main-sequence and starburst galaxies with detected CO (5 − 4) and CO (2 − 1) lines from our ALMA follow-up, normalized to the mean CO (2 − 1) flux for the main-sequence sample. The open red circles and squares indicate the mean fluxes for main-sequence, starburst (ΔMS ≥ 3.5), and extreme starburst (ΔMS ≥ 7) objects. The solid line shows the line ratios for a fully thermalized case. The gray shaded area marks the model by Narayanan & Krumholz (2014) for unresolved observations within ΣSFR = 1−10 M⊙ yr−1 kpc−2. The long dashed line indicates the simulations from Bournaud et al. (2015). The dotted line traces the empirical model by Papadopoulos et al. (2012). The dashed-dotted line points at the analytical model by Vollmer et al. (2017).
Current usage metrics show cumulative count of Article Views (full-text article views including HTML views, PDF and ePub downloads, according to the available data) and Abstracts Views on Vision4Press platform.
Data correspond to usage on the plateform after 2015. The current usage metrics is available 48-96 hours after online publication and is updated daily on week days.
Initial download of the metrics may take a while.