Fig. 6.
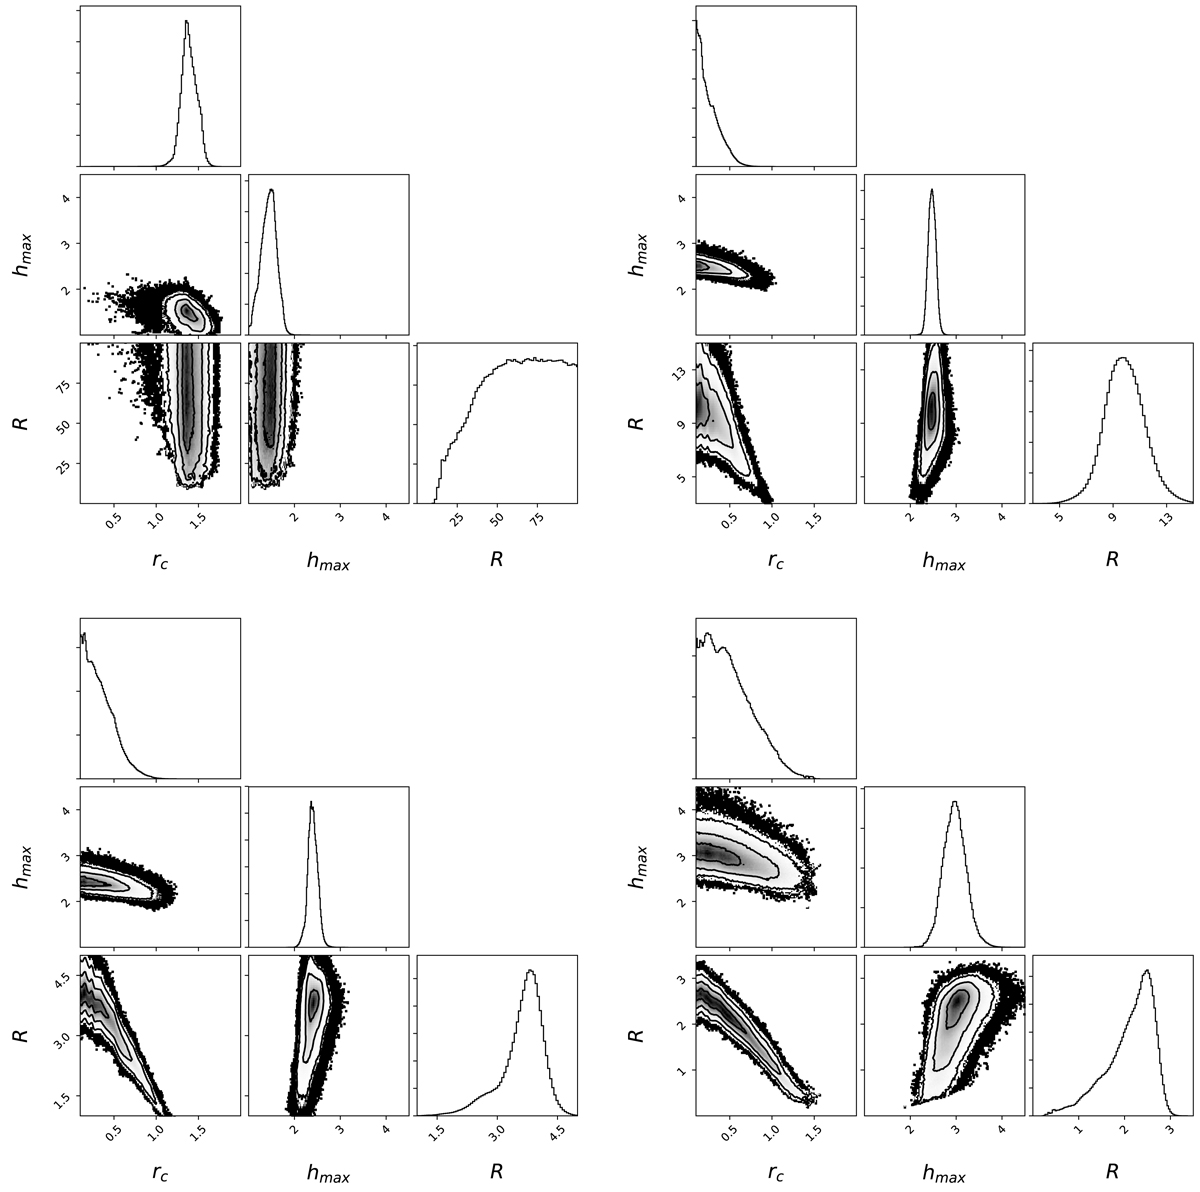
Probability distributions showing correlations between the rc, hmax, and ℛ parameters of the reflkerr_elp model with a weakly ionised disc (see Table 3) fitted in the 1.1–10 keV range to the VL (top left), L (top right), M (bottom left), and H (bottom right) spectrum, obtained in the MCMC analysis using xspec_emcee implemented by Jeremy Sanders. The results of this analysis are presented using package corner (Foreman-Mackey 2016). The contours in the 2D plots correspond to the significance of σ = 1, 2, 3. The histograms show the probability distributions for the individual parameters.
Current usage metrics show cumulative count of Article Views (full-text article views including HTML views, PDF and ePub downloads, according to the available data) and Abstracts Views on Vision4Press platform.
Data correspond to usage on the plateform after 2015. The current usage metrics is available 48-96 hours after online publication and is updated daily on week days.
Initial download of the metrics may take a while.