Fig. 5.
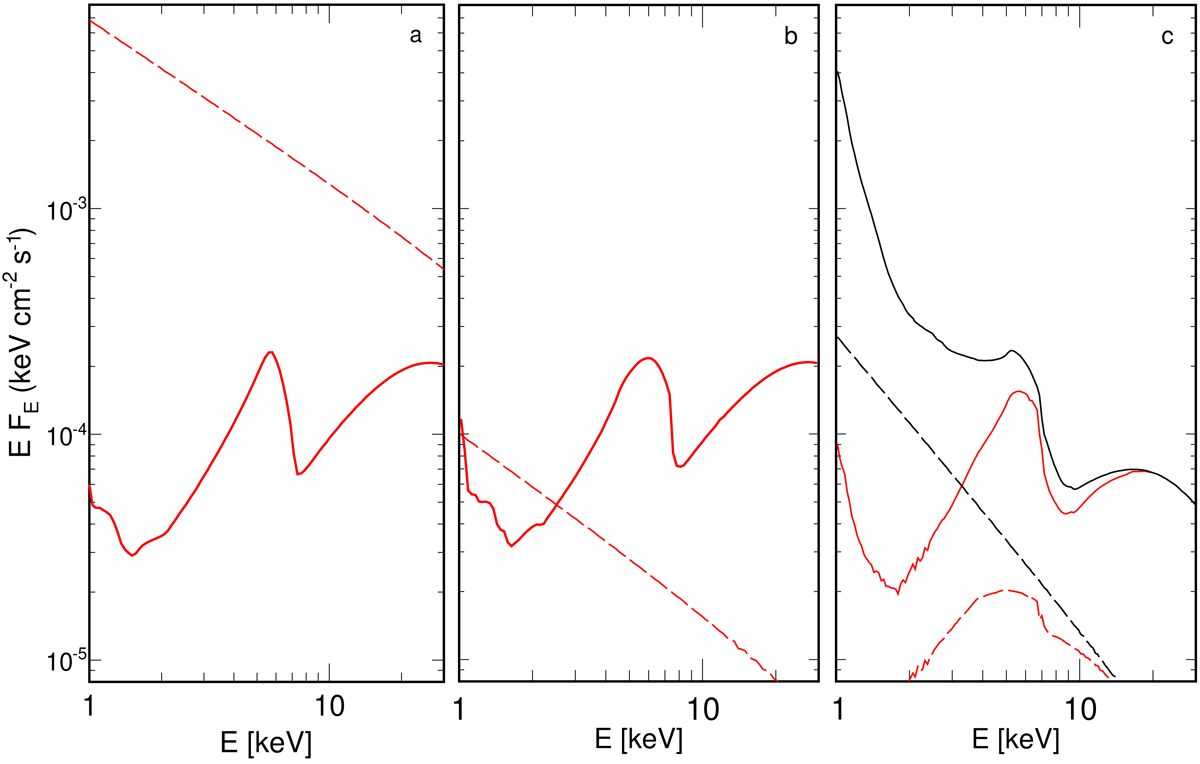
Primary (dashed) and reflected (solid) spectra in our best models for VL with panel a: reflkerr (Sect. 5.1), panel b: reflkerr_elp with a weakly ionised disc (Sect. 5.2), and panel c: reflkerr_elp with a strongly ionised disc and an ionised absorber (Sect. 5.3). The spectra correspond to the fitted parameters for VL given in Tables 1, 3, and 4, respectively, except for ℛ, which was set to the physical value, i.e. ℛ = 1. As can be seen in Fig. 4, the observed VL spectrum has a strong depression at ∼2 keV. For the models shown in panels a and b, the contribution of the primary component must be artificially reduced by a factor >750 and >25, respectively, to obtain a similar spectral depression in the total spectra. In panel c the black curves show the unabsorbed and the red curves show the absorbed spectra. In this case, the relativistic effects combined with absorption allow us to reproduce the observed shape with ℛ = 1.
Current usage metrics show cumulative count of Article Views (full-text article views including HTML views, PDF and ePub downloads, according to the available data) and Abstracts Views on Vision4Press platform.
Data correspond to usage on the plateform after 2015. The current usage metrics is available 48-96 hours after online publication and is updated daily on week days.
Initial download of the metrics may take a while.