Fig. 2.
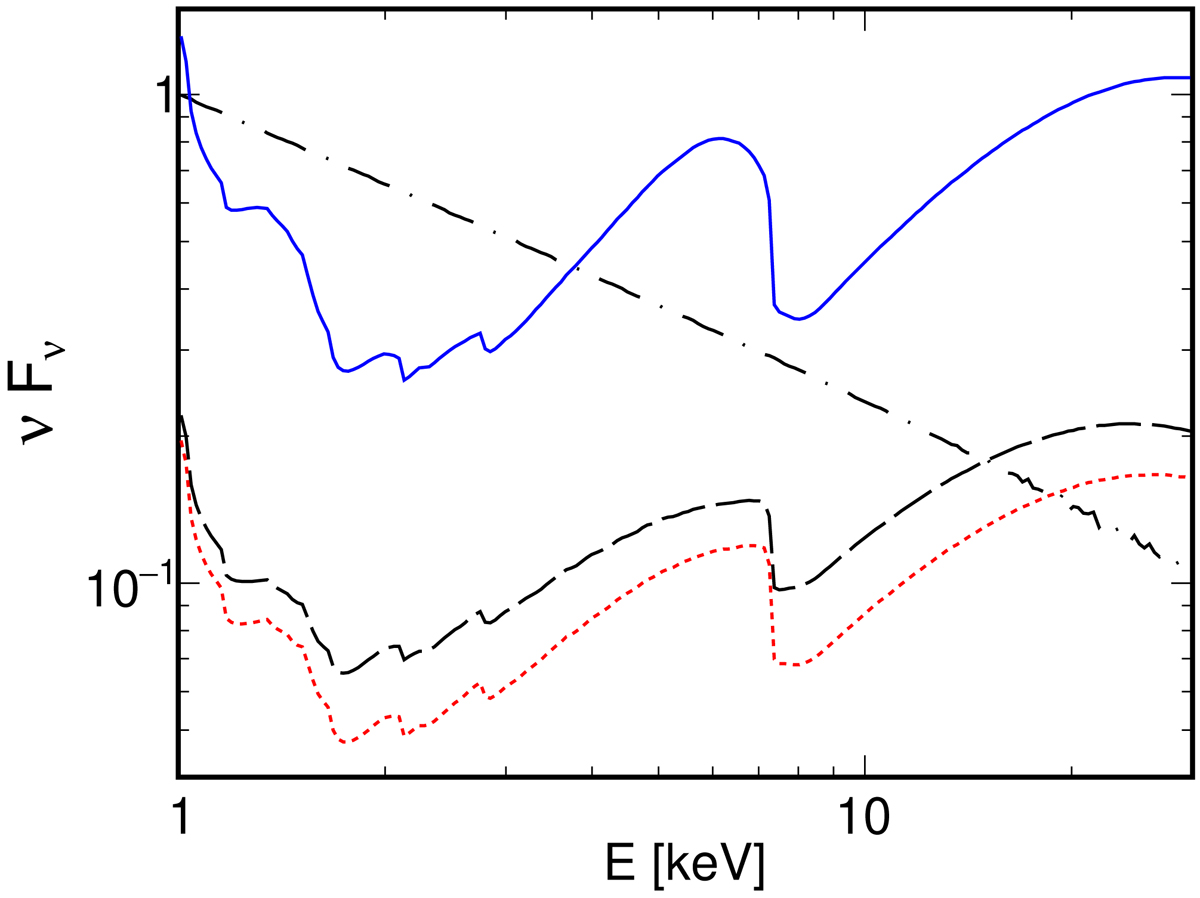
Example illustration of the effect of the rotation of the X-ray source. The dotted red curve shows the reflection spectrum computed with reflkerr_lp (i.e. for a static point-like source, at h = 2.) The dashed black and solid blue curves show the reflection spectra computed with reflkerr_elp with rc = 0.2 and 1.5, respectively, in both hmin = hhor and hmax = 2. In all three cases Γ = 2.6, ξ = 50, AFe = 9, i = 50°, a = 0.998, rin = rISCO and ℛ = 1. The observed primary spectrum is the same in all three models and is shown by the dot-dashed black curve. The difference between the reflkerr_lp and the reflkerr_elp spectra is primarily due to the azimuthal motion of the emitting plasma in the latter, where V ≃ 0.1c for rc = 0.2 and ≃0.8c for rc = 1.5.
Current usage metrics show cumulative count of Article Views (full-text article views including HTML views, PDF and ePub downloads, according to the available data) and Abstracts Views on Vision4Press platform.
Data correspond to usage on the plateform after 2015. The current usage metrics is available 48-96 hours after online publication and is updated daily on week days.
Initial download of the metrics may take a while.