Free Access
Fig. 1.
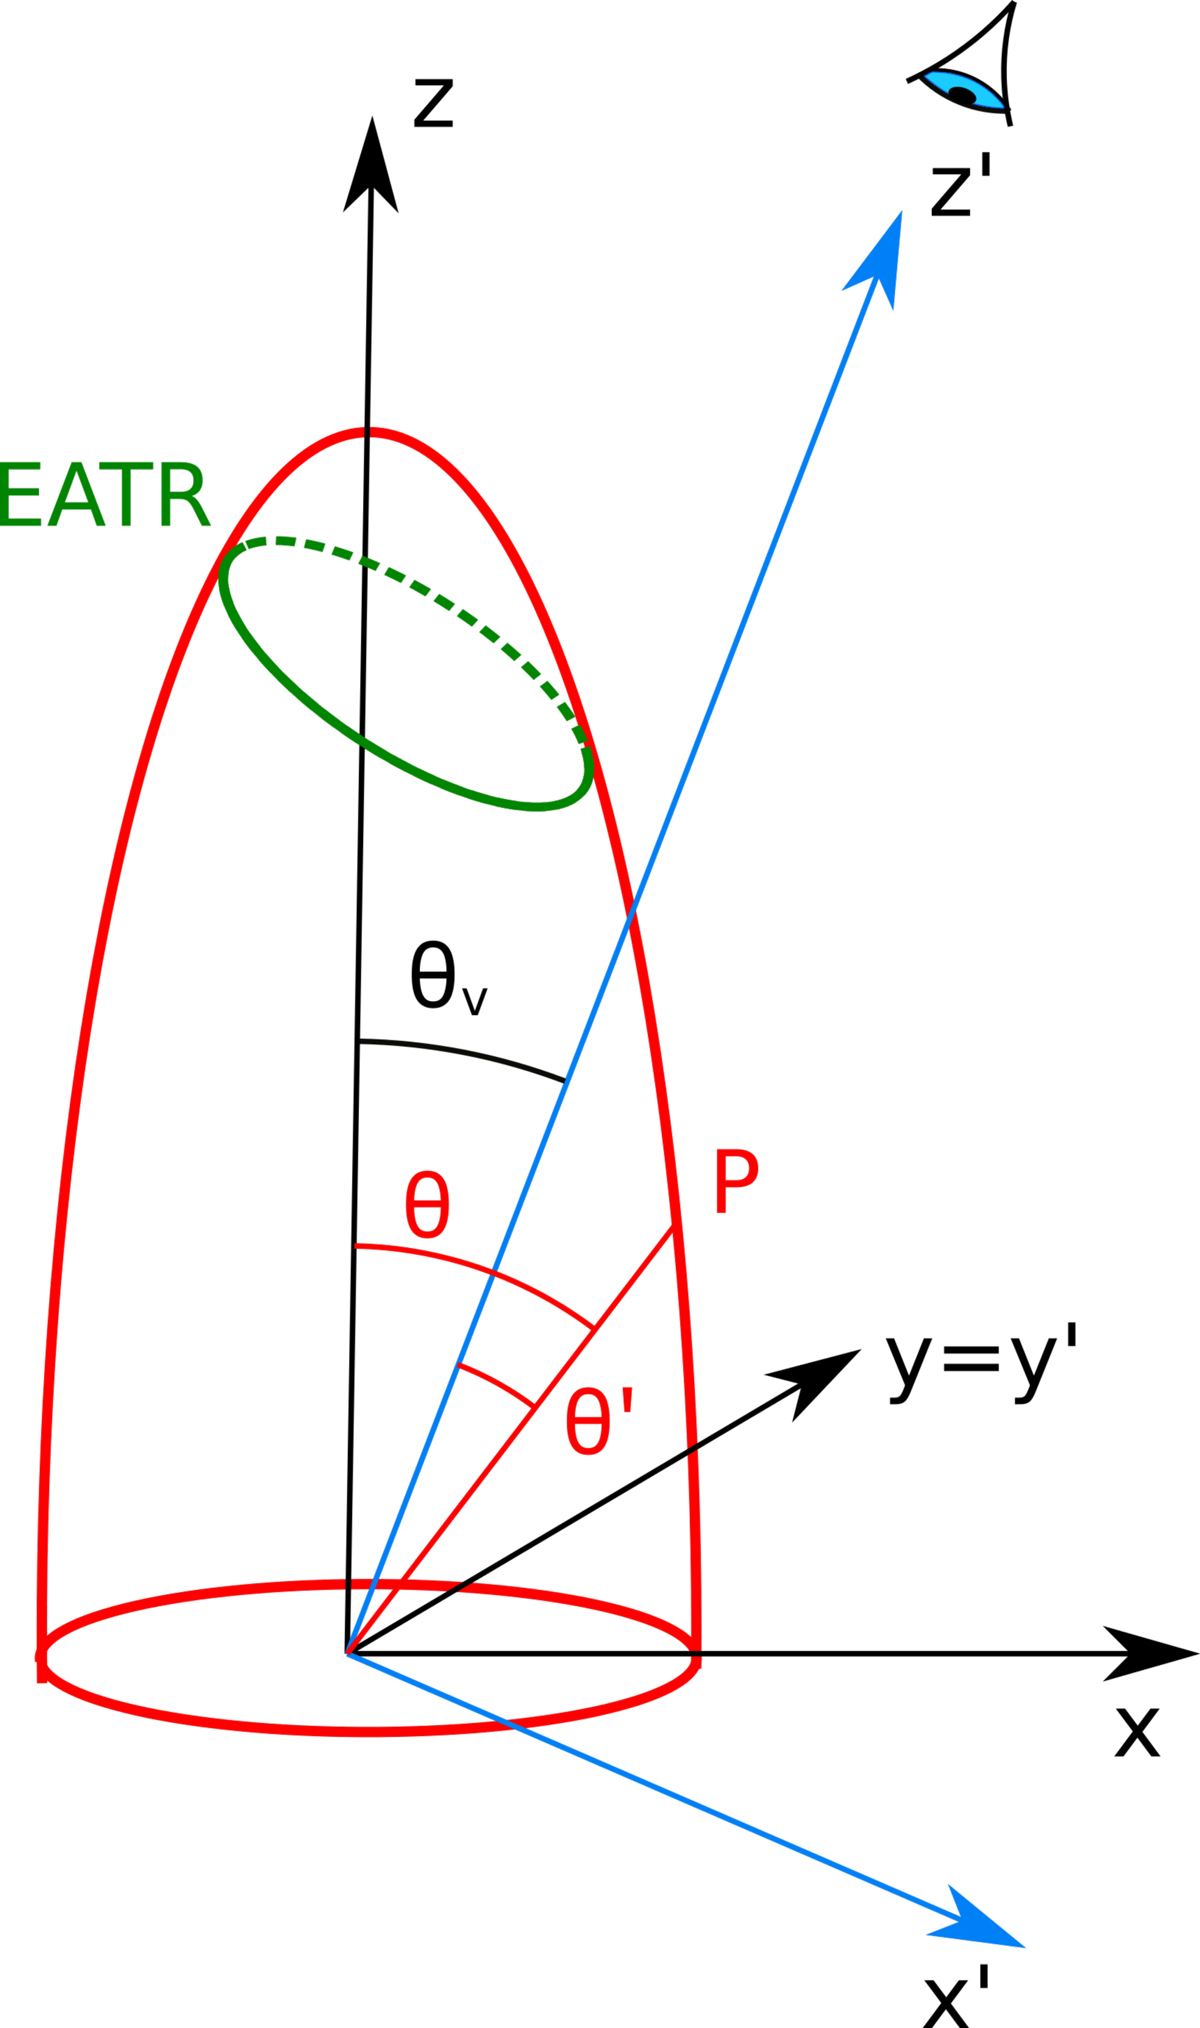
Pictorial representation of the system under study. The emitting surface is shown in red, the reference frame 𝒦 is in black, and the frame 𝒦′, with its z′ axis aligned with the line of sight, is represented in blue. The green circle shows an example of EATR.
Current usage metrics show cumulative count of Article Views (full-text article views including HTML views, PDF and ePub downloads, according to the available data) and Abstracts Views on Vision4Press platform.
Data correspond to usage on the plateform after 2015. The current usage metrics is available 48-96 hours after online publication and is updated daily on week days.
Initial download of the metrics may take a while.