Fig. 9.
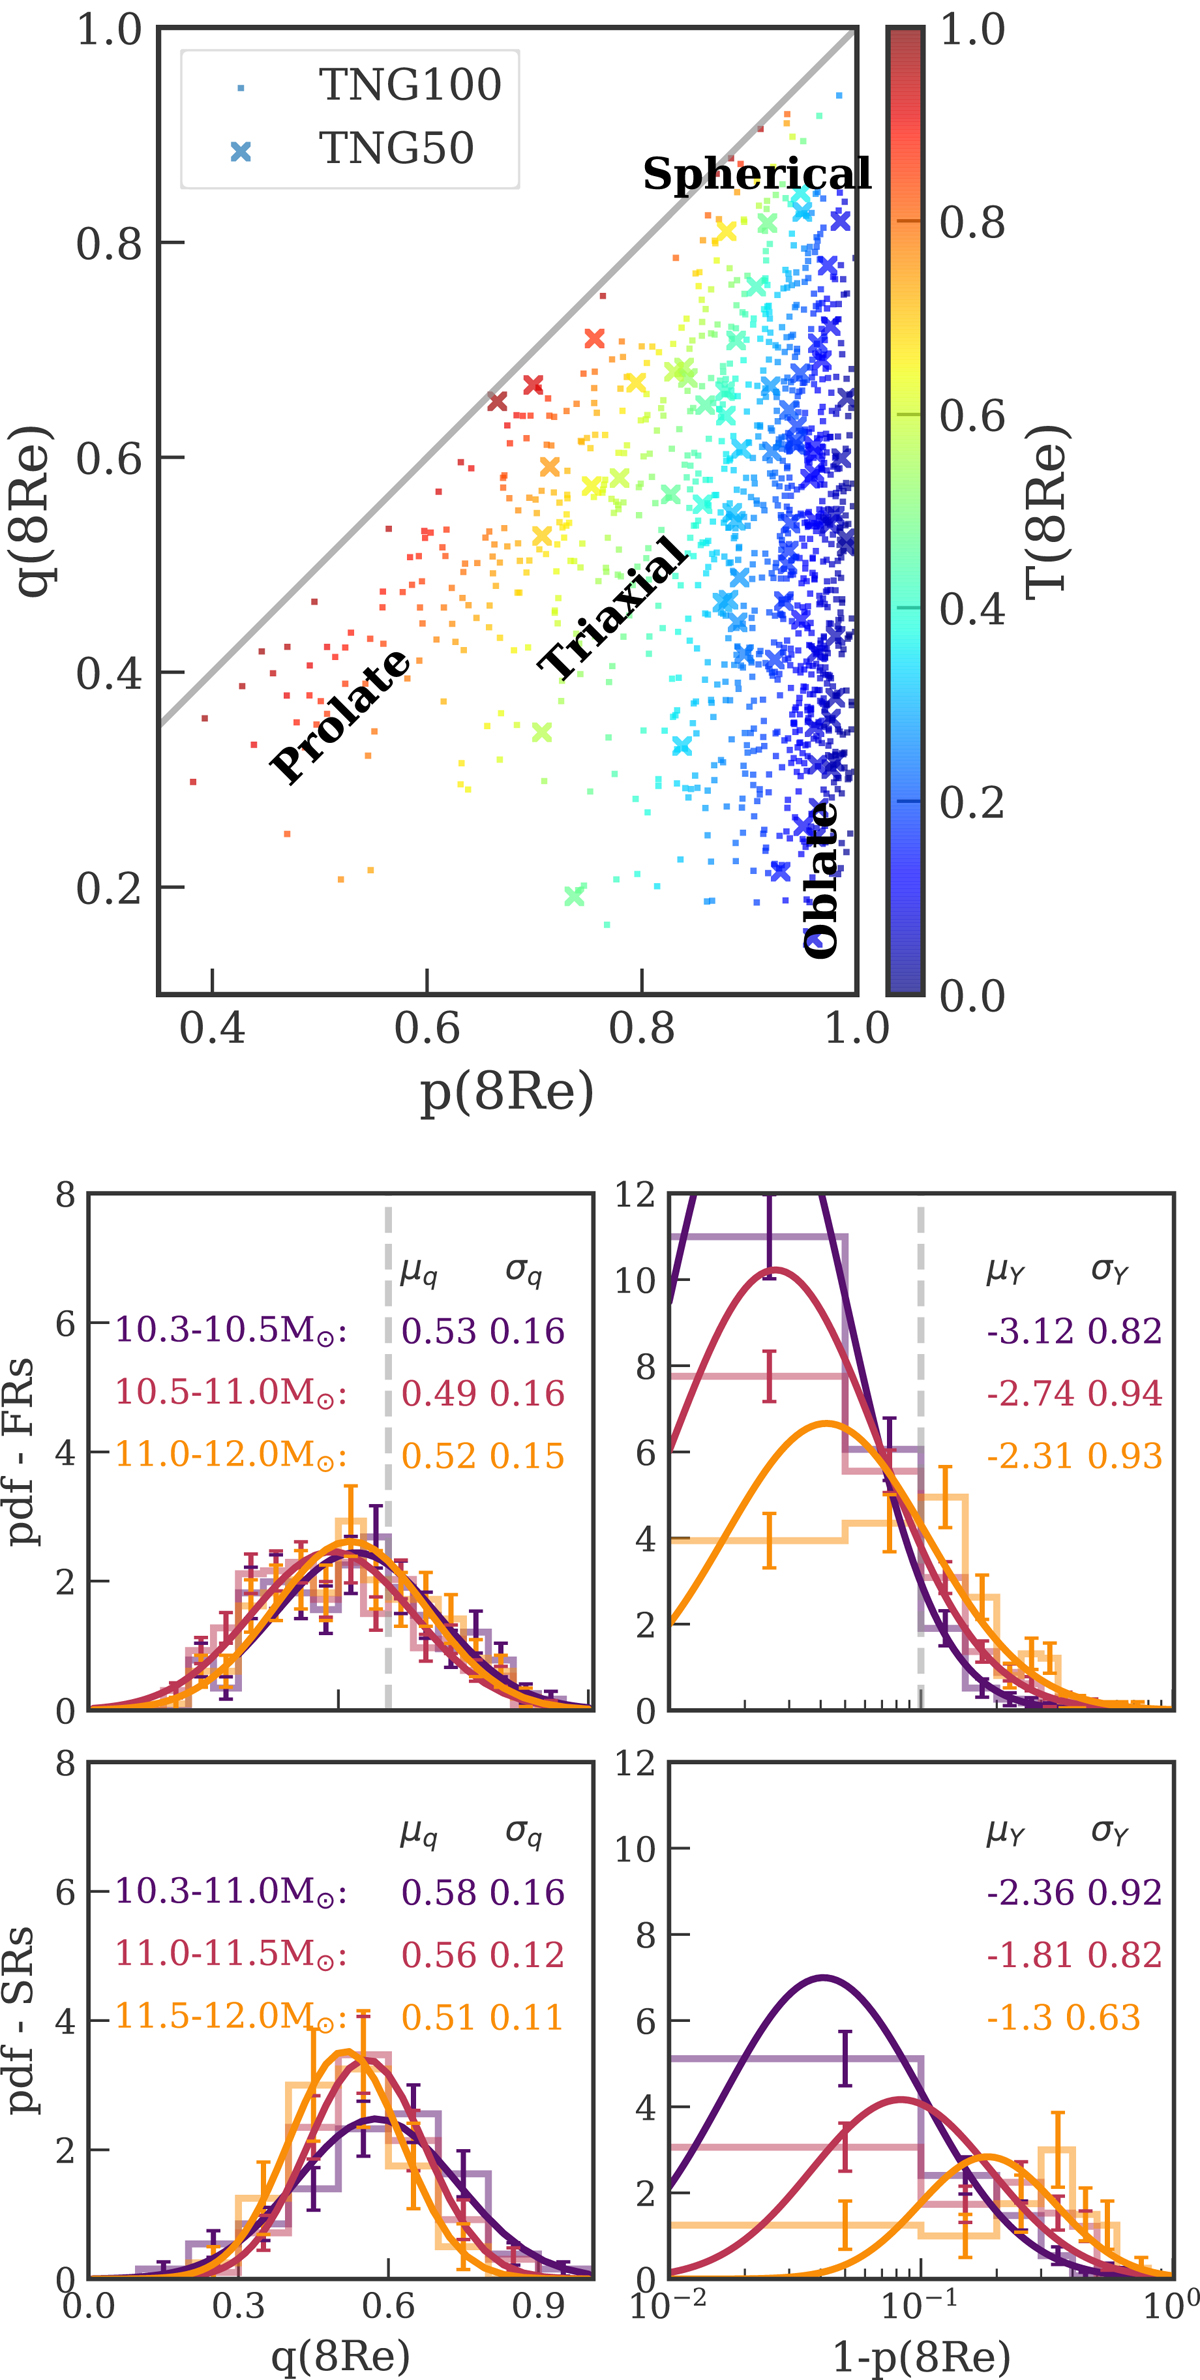
Intrinsic shape distribution of ETG stellar halos in TNG. Top: minor to major axis ratio q versus intermediate to major axis ratio p coloured by triaxiality as measured at 8 Re. TNG50 and TNG100 galaxies are shown with different symbols as in the legend. Bottom: intrinsic shape distribution for the halos (r ∼ 8 Re) of the FRs (top panels) and SRs (bottom panels) in mass intervals, shown with different colors as indicated in the figure. The fitted functions are shown with solid lines, and the fitted parameters are reported in the legend. The vertical dashed lines show the comparison with the photometric model used in Pulsoni et al. (2018) to reproduce the observed photometric twists and average ellipticities for the ePN.S survey. Most low-mass TNG galaxies have near-oblate stellar halos (top), changing towards more triaxial shapes with increasing stellar mass (bottom panels).
Current usage metrics show cumulative count of Article Views (full-text article views including HTML views, PDF and ePub downloads, according to the available data) and Abstracts Views on Vision4Press platform.
Data correspond to usage on the plateform after 2015. The current usage metrics is available 48-96 hours after online publication and is updated daily on week days.
Initial download of the metrics may take a while.