Fig. 8.
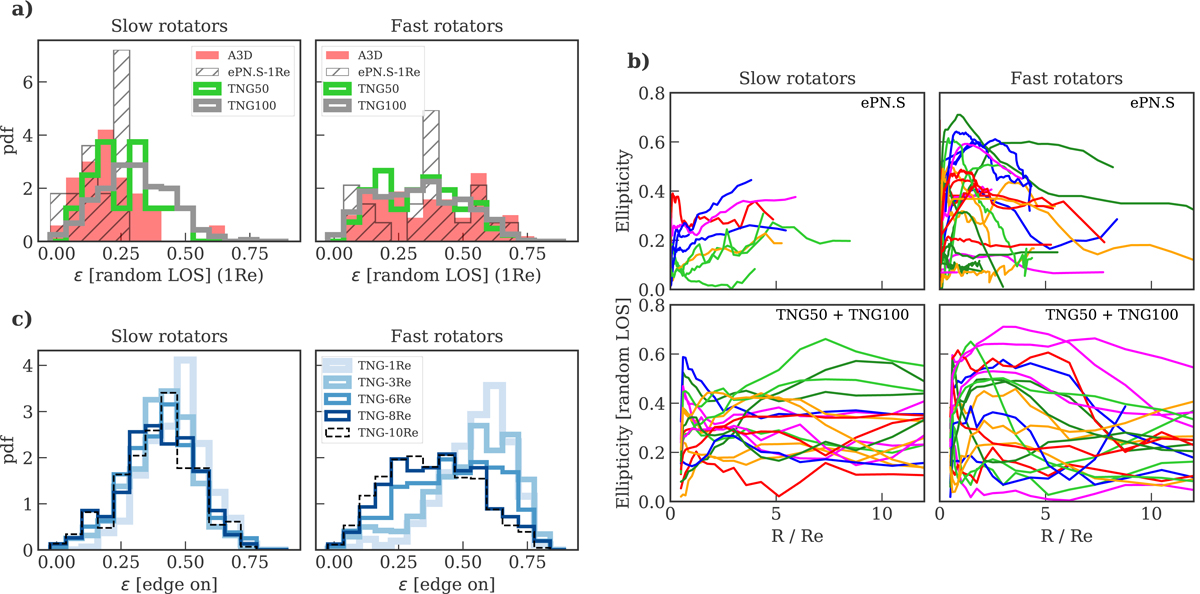
Ellipticity distribution and profiles of the selected TNG ETGs. a: distribution of the random LOS ε(1 Re) compared with Atlas3D and ePN.S as indicated in the legend. Despite some differences between the Atlas3D and the TNG SRs, the good agreement of FR distributions shows that the selected sample of TNG galaxies contains a mixture of disk and spheroidal galaxies consistent with Atlas3D. b: ellipticity profiles for the ePN.S galaxies (top) and 10 randomly selected example galaxies from TNG100 and 10 from TNG50, projected along a random LOS (bottom). The comparison between TNG and ePN.S galaxies highlights the variety of projected ellipticity profiles in both samples. c: distribution of the edge-on projected ellipticity values at different radii predicted by TNG. SRs have a rather constant ellipticity distribution with radius. The FRs have a large variety of shapes at large radii as shown by the broadening of the distribution, while the shift of the peak to lower ellipticities shows the tendency of most galaxies to become rounder in their halos.
Current usage metrics show cumulative count of Article Views (full-text article views including HTML views, PDF and ePub downloads, according to the available data) and Abstracts Views on Vision4Press platform.
Data correspond to usage on the plateform after 2015. The current usage metrics is available 48-96 hours after online publication and is updated daily on week days.
Initial download of the metrics may take a while.