Fig. 7.
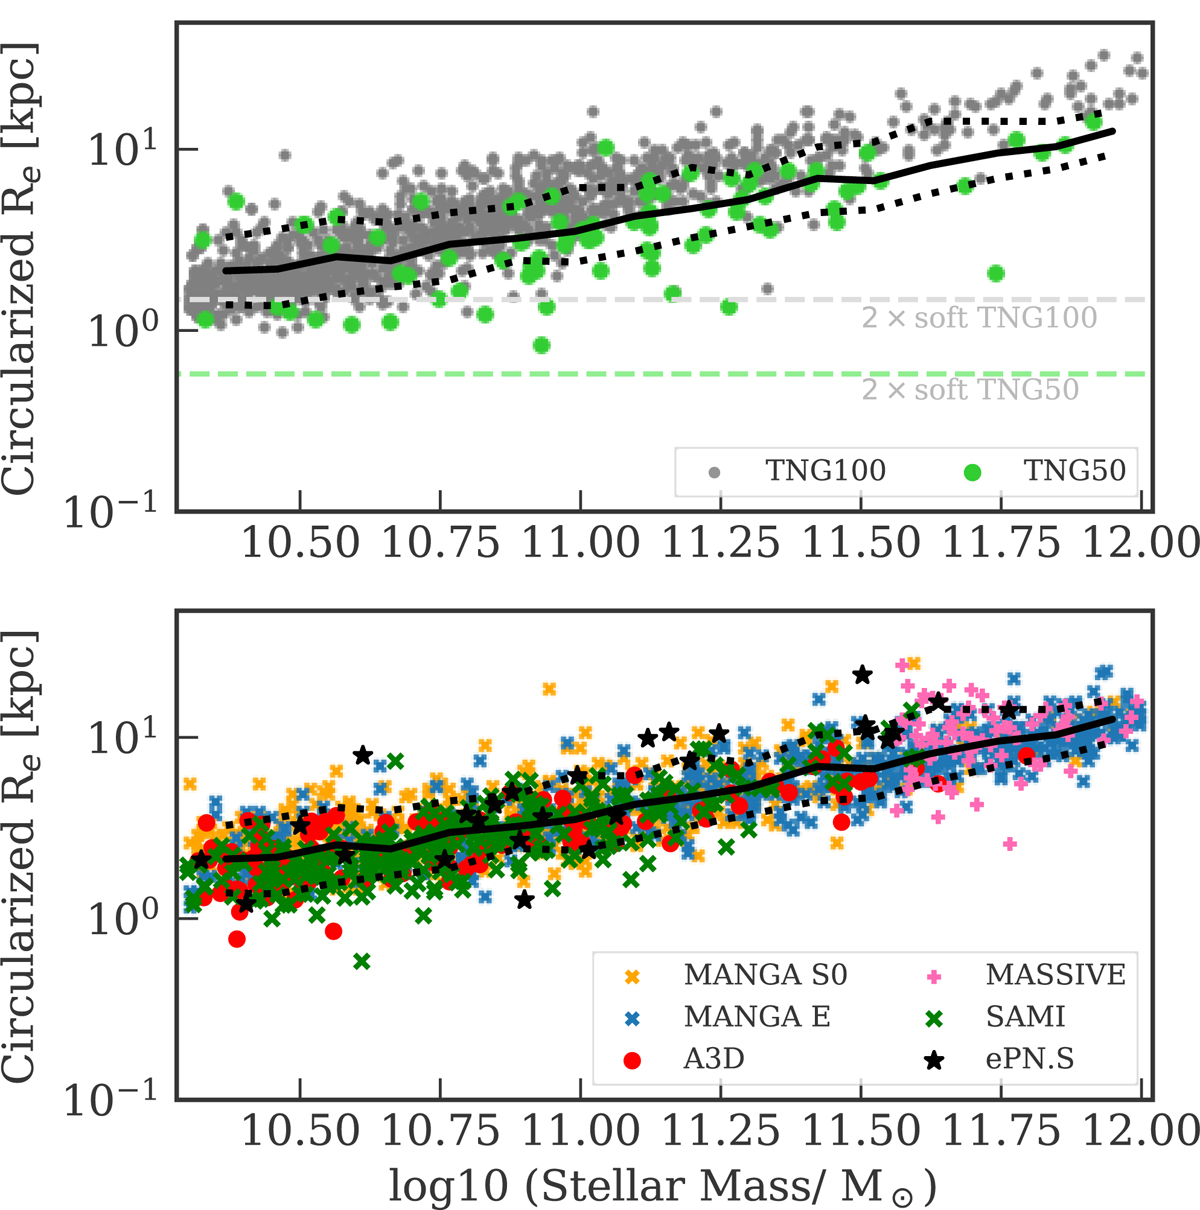
Circularized effective radii, i.e. ![]() , of the selected ETG samples in the TNG100 and TNG50 simulations as a function of stellar mass, and comparison with observations (bottom panel). The black curves show the median profile of the distribution of galaxy Re from all surveys and the 10th and 90th percentiles, in both panels. The dashed lines in the top panel indicate the resolution of the two simulations.
, of the selected ETG samples in the TNG100 and TNG50 simulations as a function of stellar mass, and comparison with observations (bottom panel). The black curves show the median profile of the distribution of galaxy Re from all surveys and the 10th and 90th percentiles, in both panels. The dashed lines in the top panel indicate the resolution of the two simulations.
Current usage metrics show cumulative count of Article Views (full-text article views including HTML views, PDF and ePub downloads, according to the available data) and Abstracts Views on Vision4Press platform.
Data correspond to usage on the plateform after 2015. The current usage metrics is available 48-96 hours after online publication and is updated daily on week days.
Initial download of the metrics may take a while.