Fig. 5.
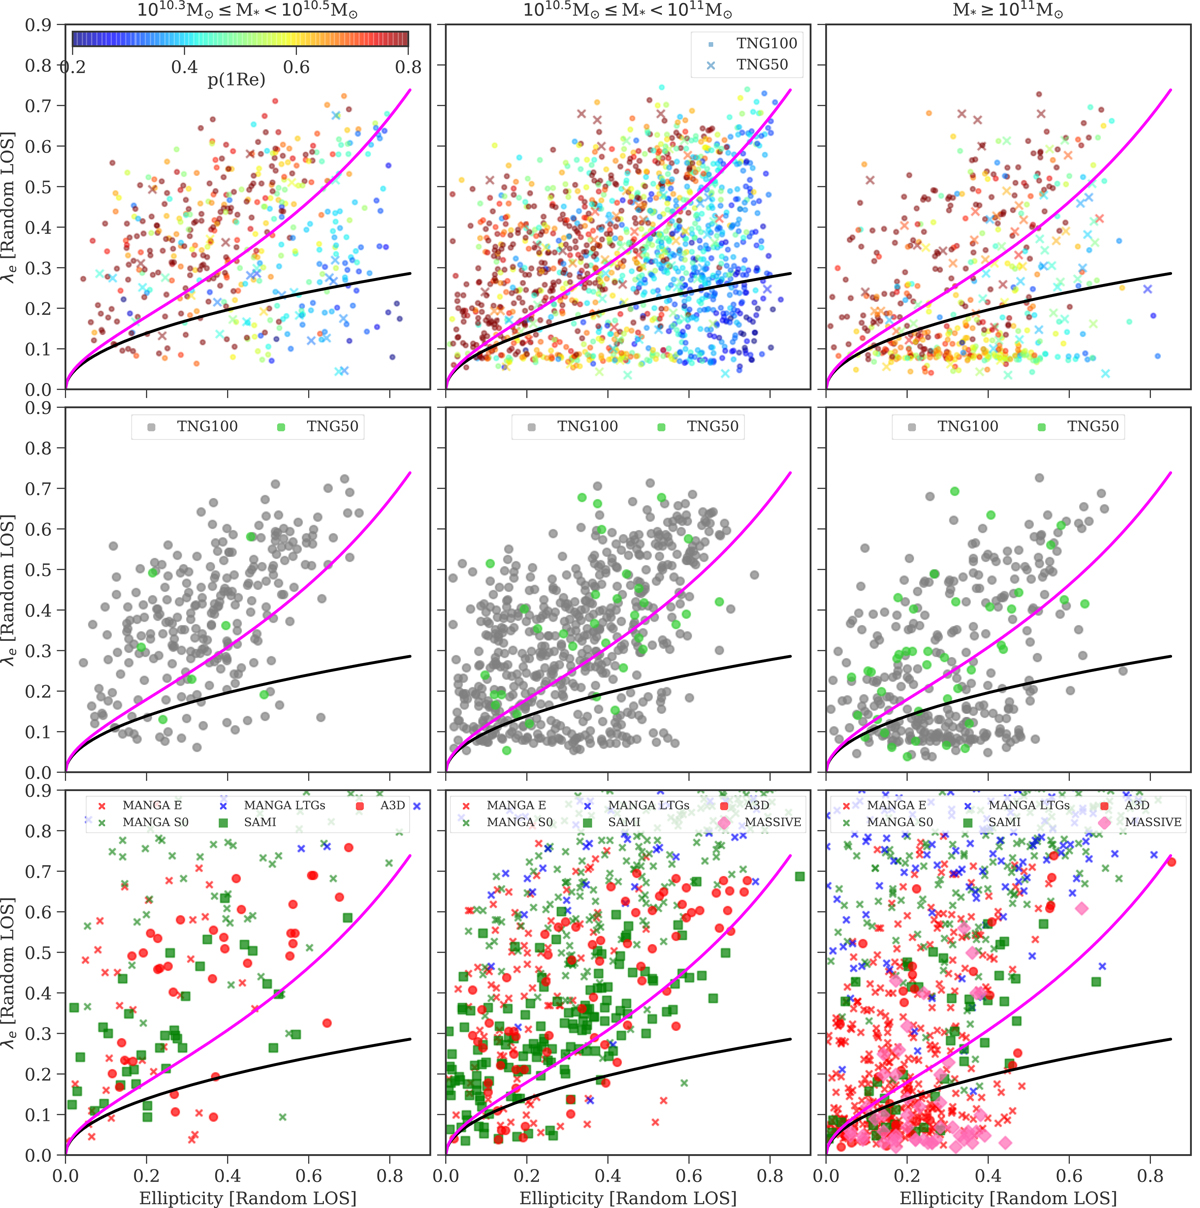
λe–ε(1 Re) diagrams for TNG and observed galaxy samples, in stellar mass bins. Top row: λ-ellipticity diagram for the sample of TNG50 and TNG100 ETGs selected by color and mass as in Fig. 3, observed along a random LOS. The galaxies are color coded according to their intermediate to major axis ratios p at 1 Re. Middle row: λ-ellipticity diagram for the TNG galaxies after the additional selection p(1 Re)≥0.6. Bottom row: λ-ellipticity plots for observed ETG samples as shown in the legend, including also late-type galaxies from the MANGA survey for comparison. Their λe and ε(1 Re) are as described in Sect. 3. The solid black line is the threshold separating fast and slow rotators as defined in Emsellem et al. (2011): ![]() . The magenta line shows the semi-empirical prediction for edge-on axisymmetric rotators with anisotropy parameter δ = 0.70εintr from Cappellari et al. (2007). After the additional removal of centrally elongated systems, the colour and mass selected TNG ETG samples give a good representation of the observed ETG samples in the λe–ε(1 Re)-plane, with the exception of the high-λe (> 0.7) S0 disks specific to the MANGA survey.
. The magenta line shows the semi-empirical prediction for edge-on axisymmetric rotators with anisotropy parameter δ = 0.70εintr from Cappellari et al. (2007). After the additional removal of centrally elongated systems, the colour and mass selected TNG ETG samples give a good representation of the observed ETG samples in the λe–ε(1 Re)-plane, with the exception of the high-λe (> 0.7) S0 disks specific to the MANGA survey.
Current usage metrics show cumulative count of Article Views (full-text article views including HTML views, PDF and ePub downloads, according to the available data) and Abstracts Views on Vision4Press platform.
Data correspond to usage on the plateform after 2015. The current usage metrics is available 48-96 hours after online publication and is updated daily on week days.
Initial download of the metrics may take a while.