Fig. 3.
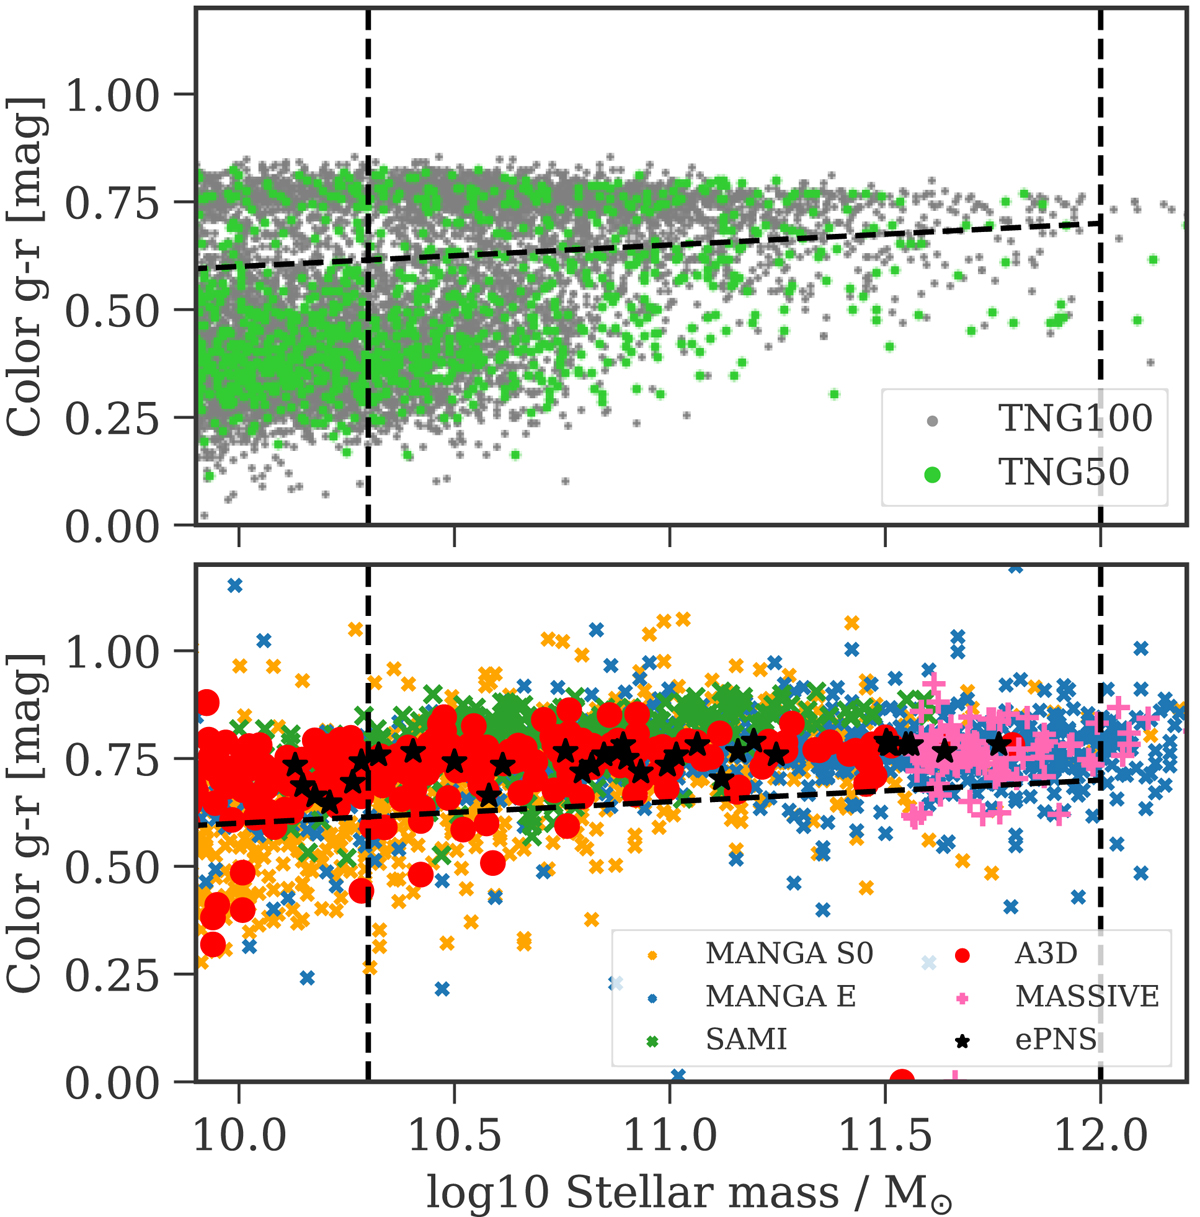
Selection of galaxies in color and stellar mass. Top: g − r color – stellar mass diagram of the simulated galaxies in TNG50 and TNG100. Red sequence galaxies are selected above the tilted dashed line, in the mass range 1010.3 < M*/M⊙ < 1012. Bottom: ETGs from recent IFS surveys as indicated. Most of the observed ETGs in this mass range fall in the same red sequence region.
Current usage metrics show cumulative count of Article Views (full-text article views including HTML views, PDF and ePub downloads, according to the available data) and Abstracts Views on Vision4Press platform.
Data correspond to usage on the plateform after 2015. The current usage metrics is available 48-96 hours after online publication and is updated daily on week days.
Initial download of the metrics may take a while.