Fig. C.3.
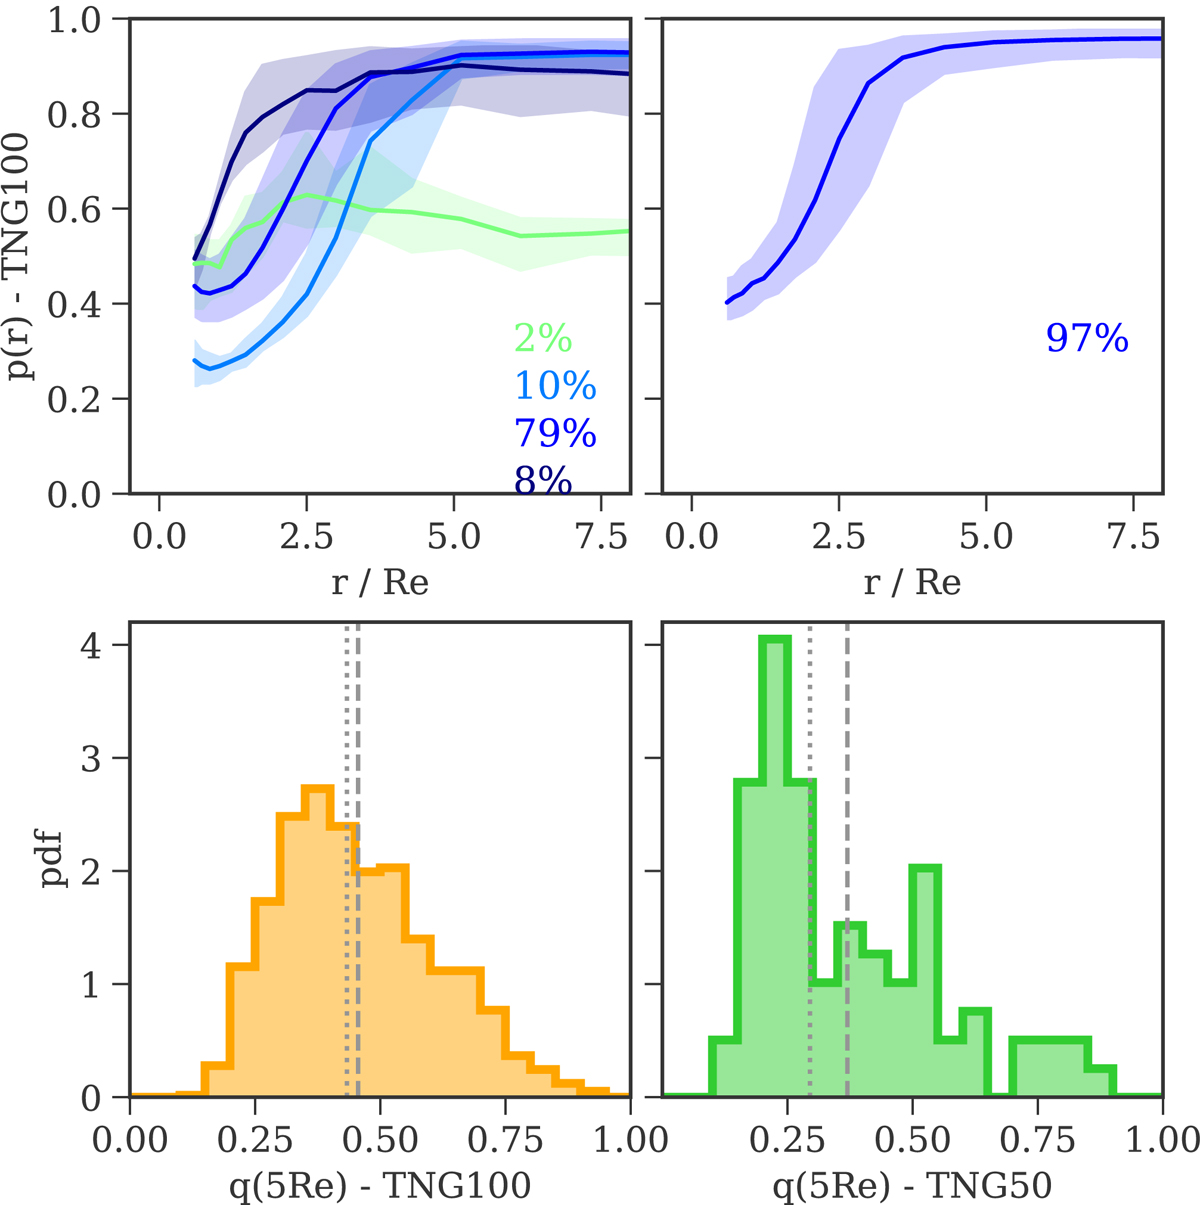
Top: median p(r) profiles for the galaxies with p(1 Re) < 0.6 in TNG100 (left) and TNG50 (right). Only bins with more than 10 galaxies are shown. The percentages indicate the fraction of centrally elongated galaxies that populate each median profile. Bottom: distribution of the axis ratio q(5 Re) in the centrally elongated galaxies of TNG100 (left) and TNG50 (right). Dashed and dotted vertical lines show the mean and the median of the distributions, respectively. The galaxies with p(1 Re) < 0.6 have elongated shapes up to ∼3 − 4 Re; outside this regions (r ∼ 5 Re) they are mostly near-oblate (p ∼ 0.9) with median flattening q ∼ 0.3 − 0.4, depending on the simulation.
Current usage metrics show cumulative count of Article Views (full-text article views including HTML views, PDF and ePub downloads, according to the available data) and Abstracts Views on Vision4Press platform.
Data correspond to usage on the plateform after 2015. The current usage metrics is available 48-96 hours after online publication and is updated daily on week days.
Initial download of the metrics may take a while.