Fig. 17.
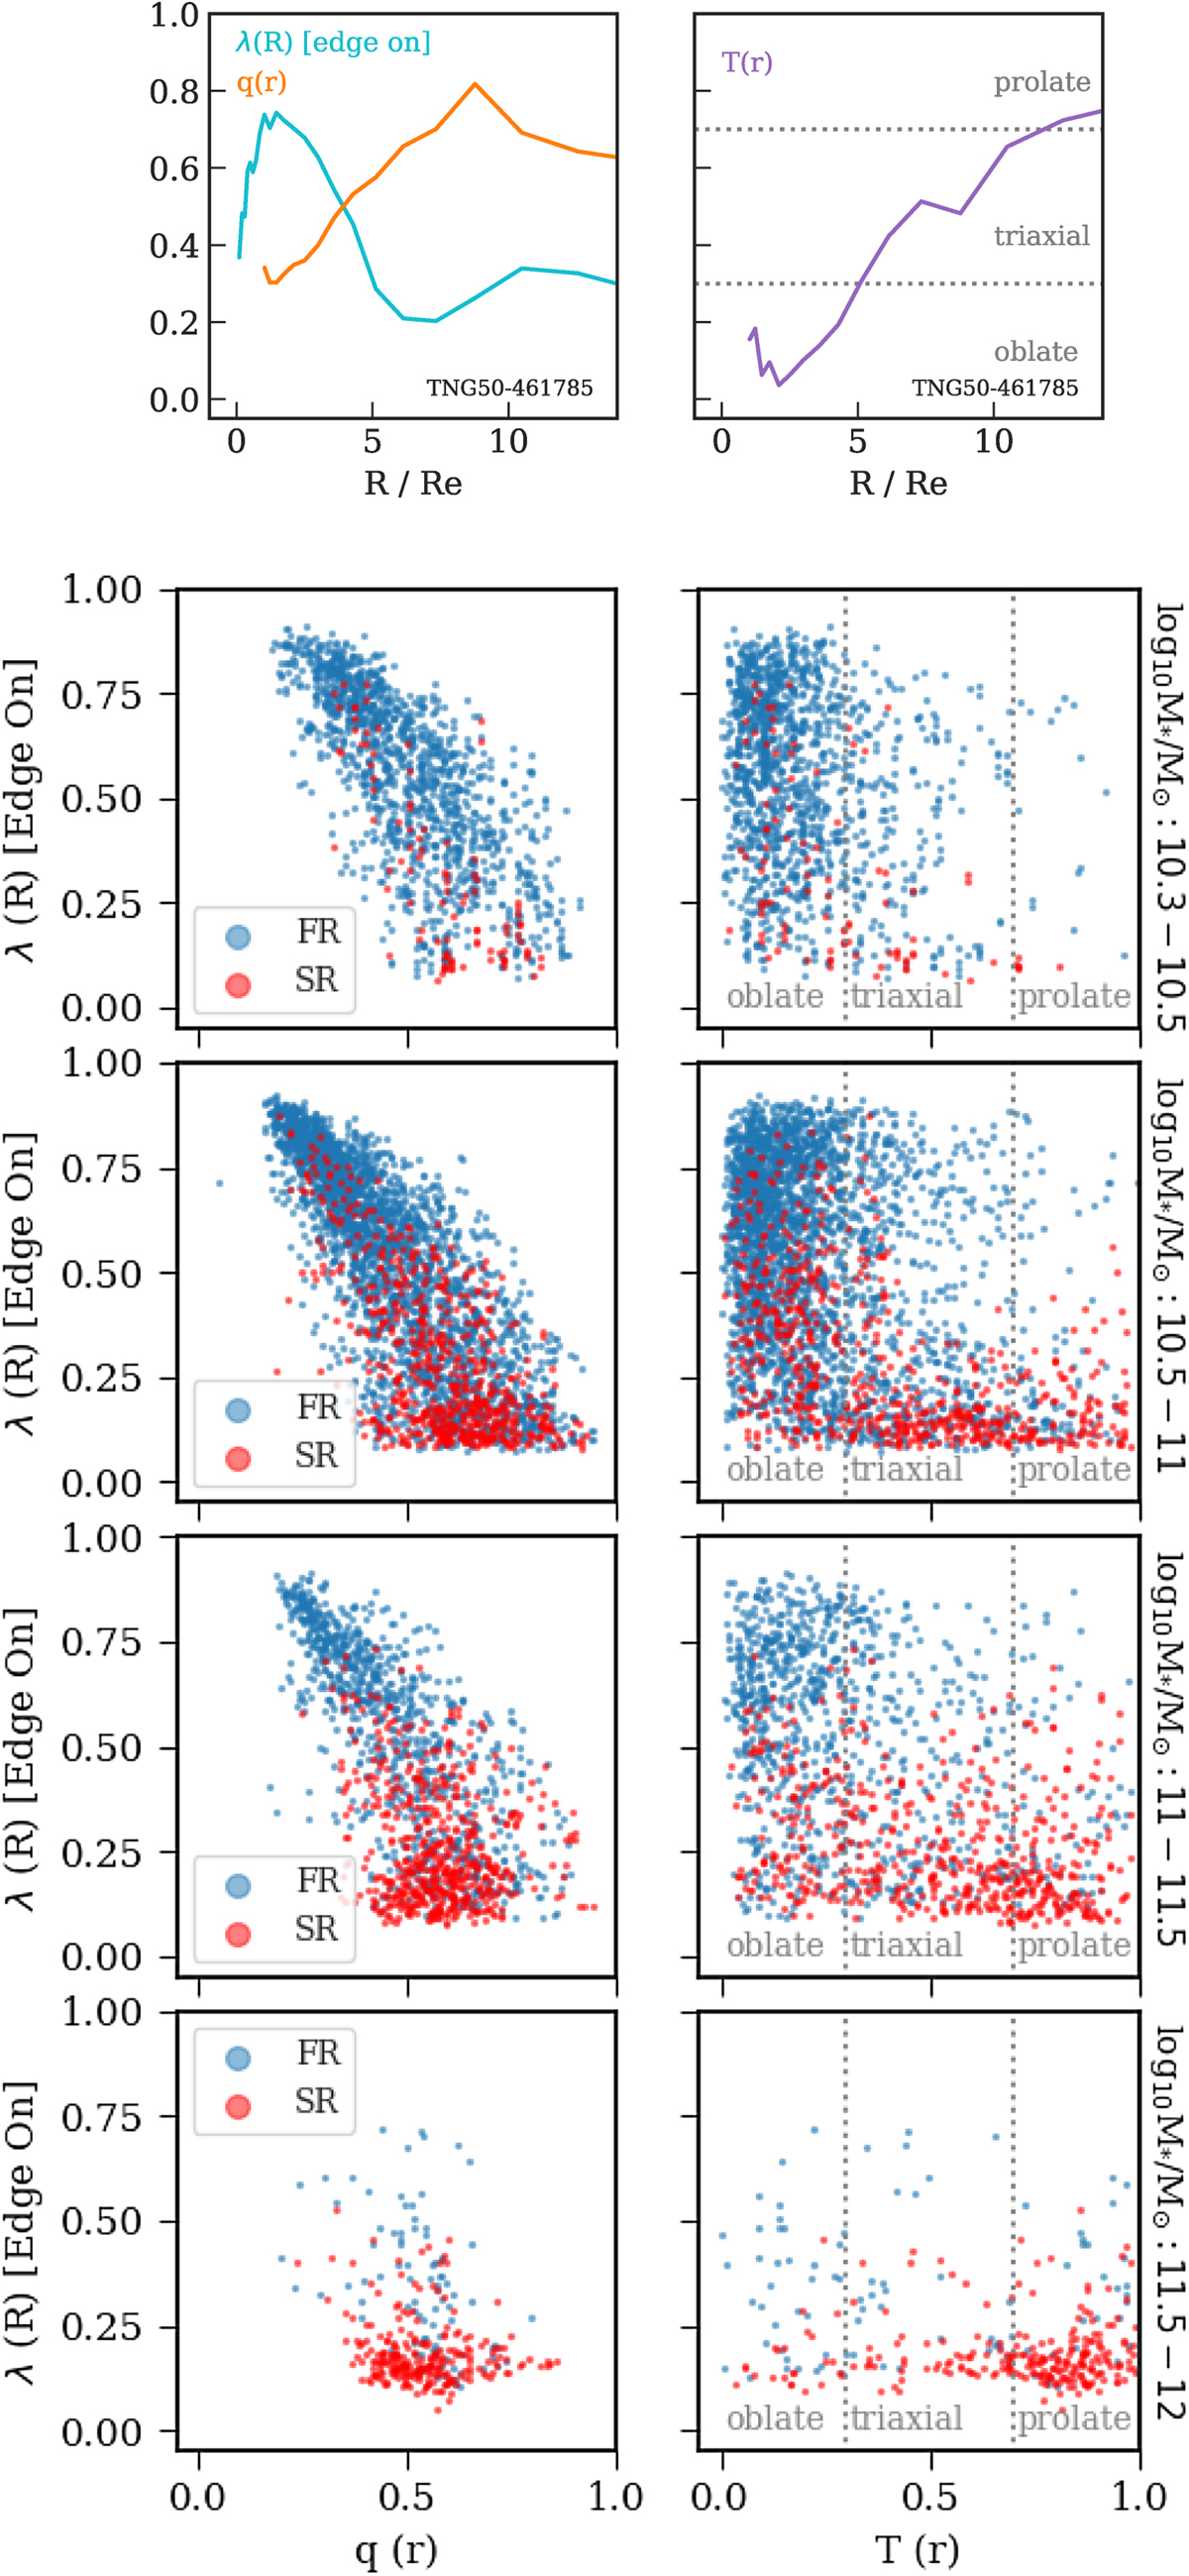
Top: λ(R), axis ratio q(r) and triaxiality T(r) profiles for an example galaxy. Bottom: λ for the edge-on projection versus minor to major axis (left panels) and triaxiality parameter (right panels) in stellar mass bins. Each data point is a local measurement within a shell of major axis R = r: each TNG galaxy is represented by ∼6 data points measured between 3.5 and 8 Re. FRs and SRs are shown with different colors as in the legend. The mass bins are labelled on the right margins. Lower rotational support λ in the stellar halos is related to rounder shapes, with a wide range of triaxiality which depends on stellar mass. FRs and SRs exhibit a continuity in stellar halo properties rather than a bimodality.
Current usage metrics show cumulative count of Article Views (full-text article views including HTML views, PDF and ePub downloads, according to the available data) and Abstracts Views on Vision4Press platform.
Data correspond to usage on the plateform after 2015. The current usage metrics is available 48-96 hours after online publication and is updated daily on week days.
Initial download of the metrics may take a while.