Fig. 16.
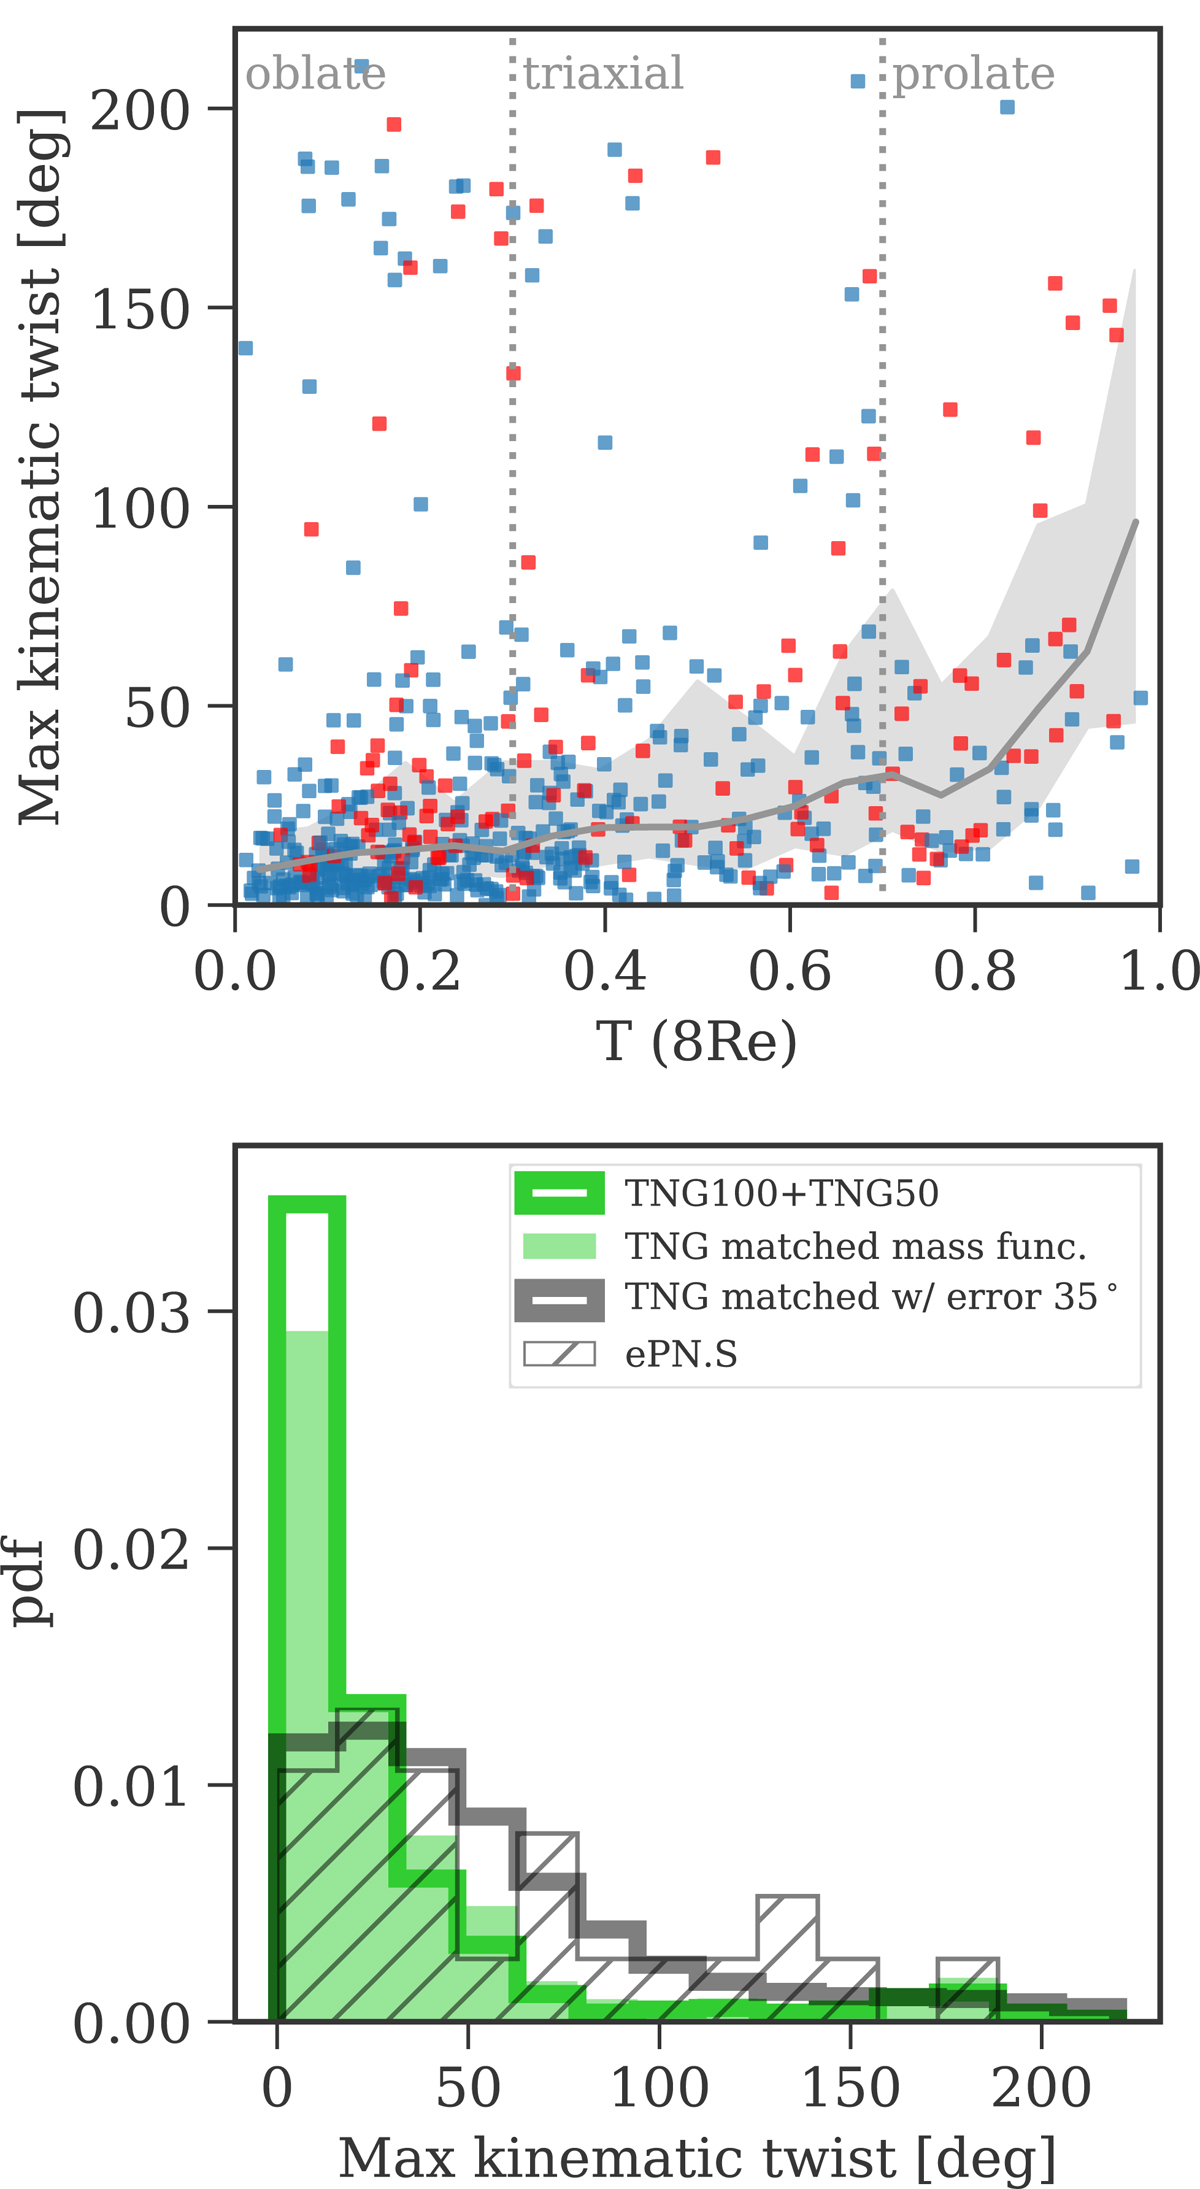
Top: maximum kinematic twist measured between 1 and 8 Re as a function of the stellar halo triaxiality T(8 Re). FRs are shown in blue, SRs in red; both TNG50 and TNG100 samples are shown. The gray line and shaded band show the median of the twist distribution as a function of T(8 Re) and the 25th and 75th percentiles. Even though the majority of the TNG galaxies have small kinematic twists, high T galaxies are more like to display a kinematic twist. Bottom: distribution of the maximum kinematic twist for the TNG50 and TNG100 samples (green step histogram) compared with the ePN.S sample (hatched histogram). The filled green histogram shows the distribution of the TNG galaxies after their mass function is matched to that of the ePN.S sample; the gray histogram is the mass-matched TNG distribution convolved with a measurement error and is consistent with the data.
Current usage metrics show cumulative count of Article Views (full-text article views including HTML views, PDF and ePub downloads, according to the available data) and Abstracts Views on Vision4Press platform.
Data correspond to usage on the plateform after 2015. The current usage metrics is available 48-96 hours after online publication and is updated daily on week days.
Initial download of the metrics may take a while.