Fig. 15.
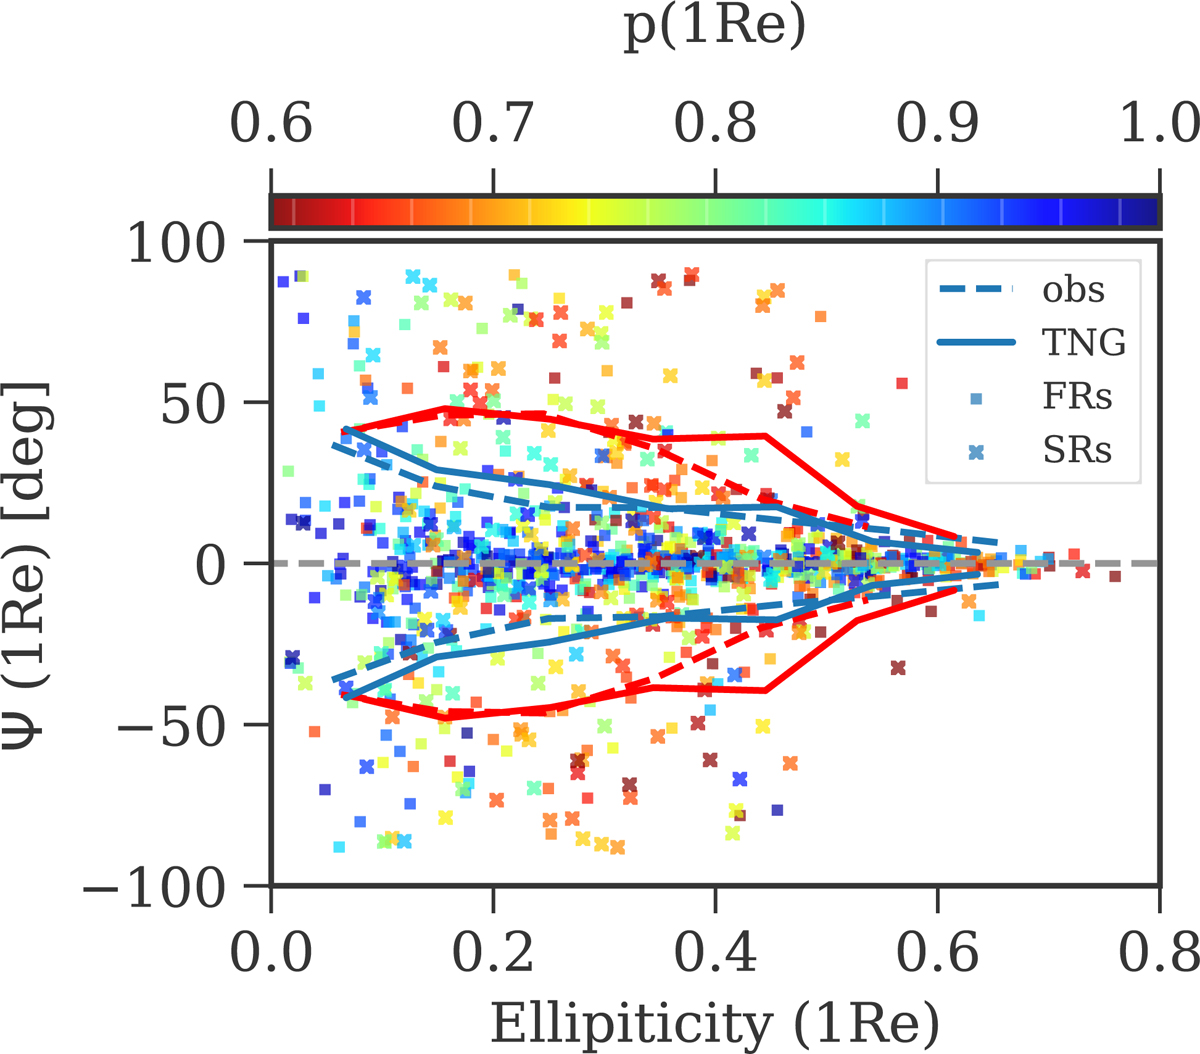
Distribution of the misalignments Ψ = PAkin − PAphot at 1 Re as a function of the ellipticity for both TNG100 and TNG50 galaxies. Data points are color coded according to their intermediate to major axis ratio p(1 Re); open symbols are SRs, filled symbols are FRs. The solid lines show the scatter of the misalignments as a function of the ellipticity for the TNG galaxies, calculated on the mirrored (Ψ, −Ψ) data. The dashed lines show the scatter for the MANGA and Atlas3D galaxies. Red lines are for the SRs, blue lines for the FRs. The triaxiality of the IllustrisTNG FRs is consistent with the near-alignment of their kinematic and photometric position angles.
Current usage metrics show cumulative count of Article Views (full-text article views including HTML views, PDF and ePub downloads, according to the available data) and Abstracts Views on Vision4Press platform.
Data correspond to usage on the plateform after 2015. The current usage metrics is available 48-96 hours after online publication and is updated daily on week days.
Initial download of the metrics may take a while.