Fig. 14.
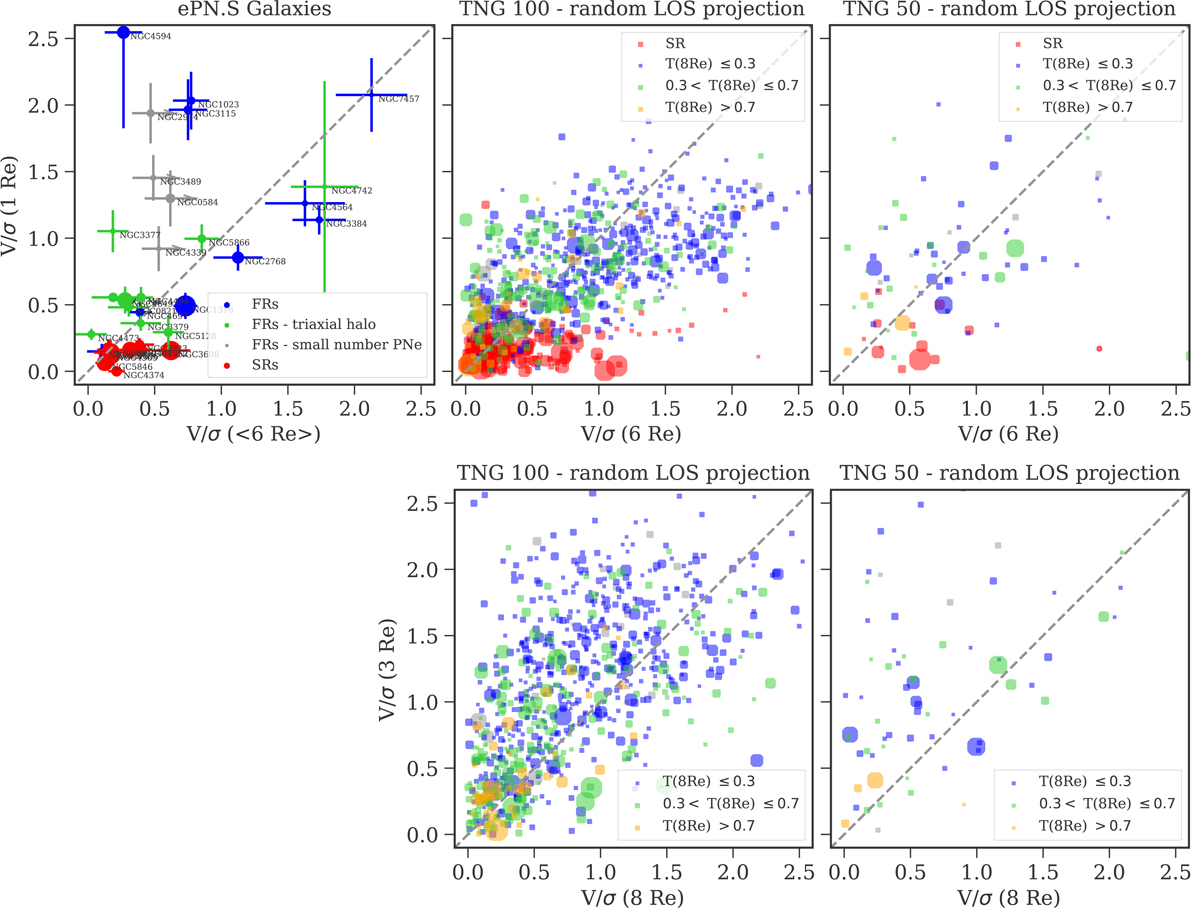
V/σ ratio in the central regions compared with the V/σ at large radii. Top: V/σ(1 Re) versus V/σ(6 Re) for the ePN.S galaxies (left), TNG100 (middle), and TNG50 (right). Bottom: V/σ(3 Re) versus V/σ(8 Re) for TNG100 (left) and TNG50 (right). Different colors in the ePN.S sample mark the SRs (in red), the FRs with kinematic signatures for triaxial halos (i.e. with kinematic twists or misaligments, in green), and FRs with PAkin aligned with PAphot (in blue). The gray points stand for ePN.S FRs for which the measured Vrot/σ(⟨6 Re⟩) is a lower limit. For the simulated galaxies the different colors mark SRs, and FRs with different halo T(8 Re): FRs that have near-oblate halos (in blue); FRs with triaxial halos (in green); near-prolate FRs (in orange). The gray symbols show simulated galaxies with too few particles at 8 Re for measuring T. The size of the data points is proportional to the stellar mass. The gray dashed lines show the 1:1 relation. The TNG simulations reproduce the diversity of observed ETG halo kinematics and they echo the observed kinematic transitions between the central regions and outskirts of the FR galaxies, albeit at larger radii.
Current usage metrics show cumulative count of Article Views (full-text article views including HTML views, PDF and ePub downloads, according to the available data) and Abstracts Views on Vision4Press platform.
Data correspond to usage on the plateform after 2015. The current usage metrics is available 48-96 hours after online publication and is updated daily on week days.
Initial download of the metrics may take a while.