Fig. 13.
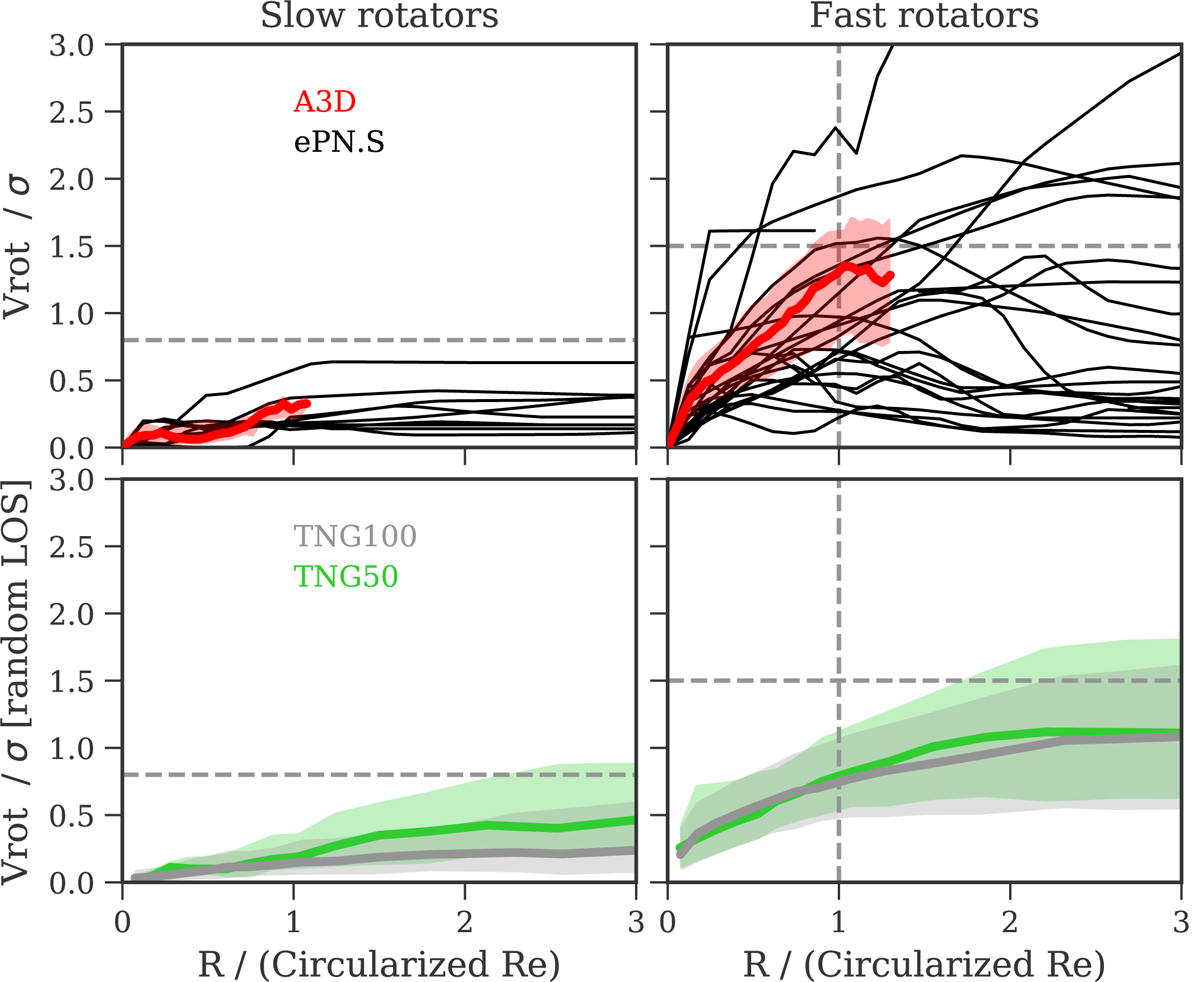
Median Vrot/σ profiles for slow rotators (left) and fast rotators (right panels). Top: observations from Atlas3D and ePN.S. For the former we show median profiles and shaded areas bounded by the 20th and the 80th percentiles of the distribution. For the ePN.S galaxies we show individual profiles. Bottom: median profiles and 20%−80% distributions for the TNG50 and TNG100 ETGs, projected along a random LOS. Vertical and horizontal dashed lines are for guiding the eyes in comparing top with bottom panels. This shows that the average Vrot/σ profiles of the simulated ETGs are shallower than the observed profiles.
Current usage metrics show cumulative count of Article Views (full-text article views including HTML views, PDF and ePub downloads, according to the available data) and Abstracts Views on Vision4Press platform.
Data correspond to usage on the plateform after 2015. The current usage metrics is available 48-96 hours after online publication and is updated daily on week days.
Initial download of the metrics may take a while.