Fig. 12.
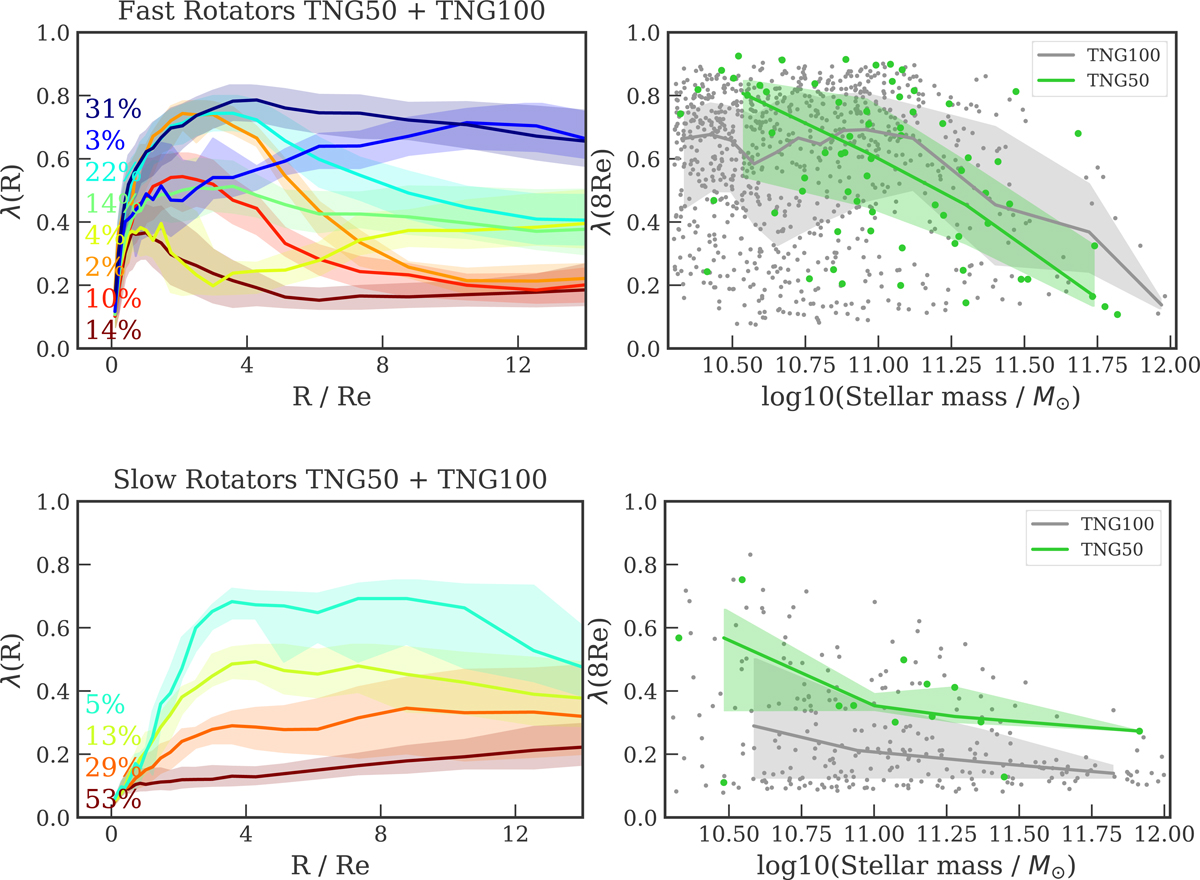
Left: median λ profiles for fast rotators (upper left) and slow rotators (lower left panel) in their edge on projection. The median profiles are built by binning the galaxies according to the shape of their λ profiles; see text. The shaded areas are bounded by the 25th and 75th percentiles of the distributions. The numbers on the left indicate the percentage of FRs or SRs populating each profile. Right: distribution of λ(8 Re) for the full sample, as a function of stellar mass. FRs and SRs are shown separately, as well as TNG50 and TNG100. FR galaxies show a large variety of λ profiles, whereas SRs have either constant or increased λ in the stellar halo. Overall the halo rotational support decreases at high stellar masses.
Current usage metrics show cumulative count of Article Views (full-text article views including HTML views, PDF and ePub downloads, according to the available data) and Abstracts Views on Vision4Press platform.
Data correspond to usage on the plateform after 2015. The current usage metrics is available 48-96 hours after online publication and is updated daily on week days.
Initial download of the metrics may take a while.