Fig. 10.
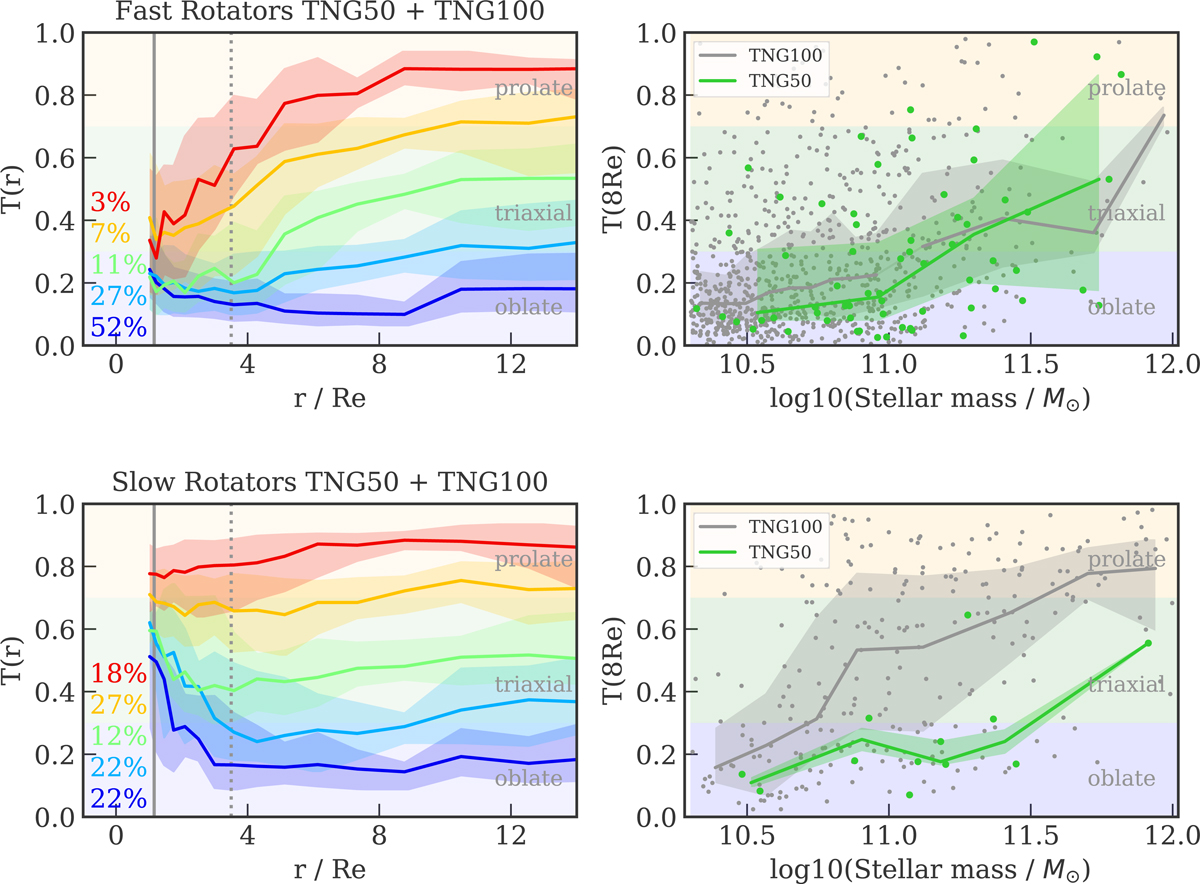
Left panels: median triaxiality profiles for the fast rotators (top) and the slow rotators (bottom). The numbers on the left indicate the percentage of FRs or SRs populating each profile. The vertical dotted lines show r = 9 rsoft for TNG100 galaxies with M* ∼ 1010.3 M⊙, the solid lines show r = 9 rsoft for TNG100 galaxies with M* ∼ 1011 M⊙. At radii larger than these the profiles are not affected by resolution issues. Right panels: median of the stellar halo triaxiality distribution measured at 8 Re as a function of stellar mass. The shaded areas are contoured by the 25th and 75th percentiles of the distribution. TNG100 and TNG50 are shown separately, FRs are on top, SRs on the bottom. On average the triaxiality parameter increases with radius and with stellar mass. The FRs have increasing T(r) profiles, while SRs have either constant or decreasing profiles.
Current usage metrics show cumulative count of Article Views (full-text article views including HTML views, PDF and ePub downloads, according to the available data) and Abstracts Views on Vision4Press platform.
Data correspond to usage on the plateform after 2015. The current usage metrics is available 48-96 hours after online publication and is updated daily on week days.
Initial download of the metrics may take a while.