Fig. 6.
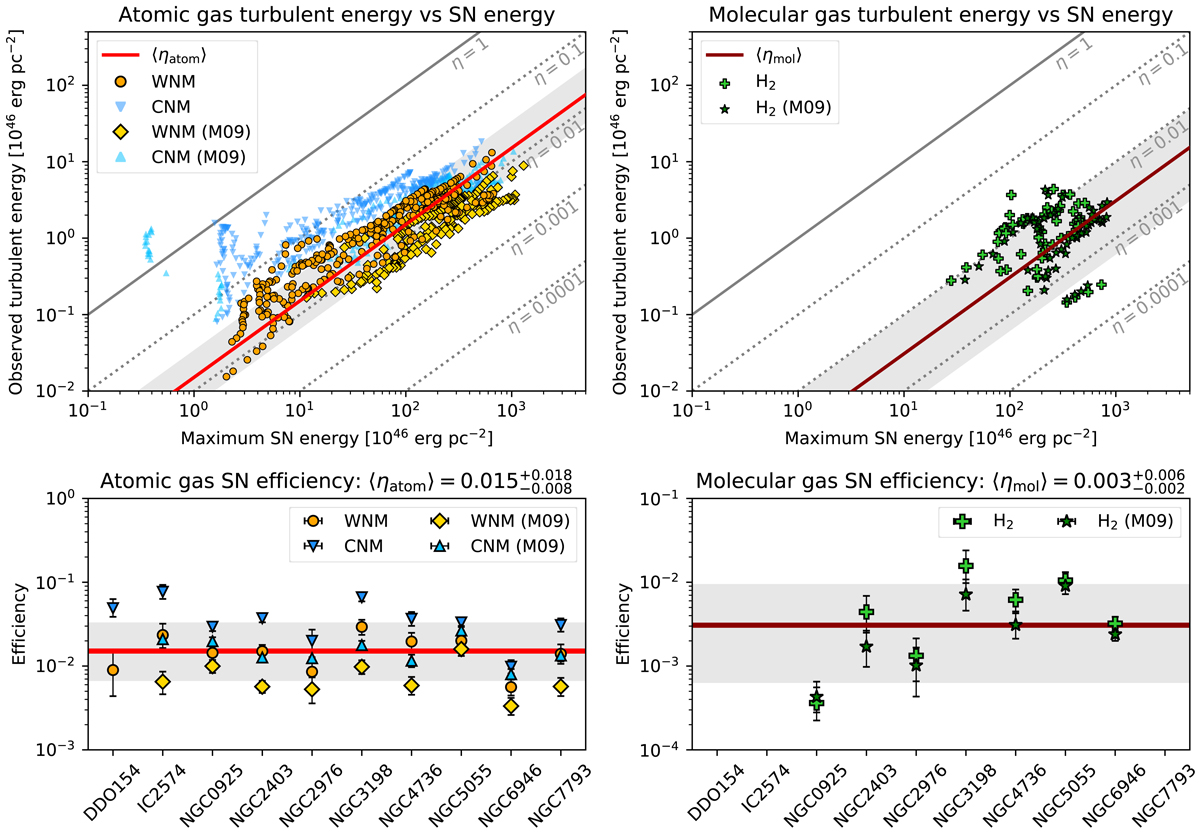
Top row: maximum energy provided by SNe in a dissipation timescale versus the turbulent component of the observed energy, both for the atomic gas (left) and the molecular gas (right). Left panel: the orange points and the blue triangles are respectively for the cases of CNM and of WNM with ΣSFR from Leroy et al. (2008) and Bigiel et al. (2010), while the yellow diamonds and the light blue triangles show the corresponding cases with ΣSFR from Muñoz-Mateos et al. (2009). Each point is for a single galaxy and for a single radius. Right panel: the light green crosses and the green stars are the same quantities for the molecular gas obtained with the two ΣSFR. The red and the dark red lines show the relations built with the “global” efficiencies for the atomic gas ⟨ηatom⟩ and the molecular gas ⟨ηmol⟩ respectively (see text), with grey areas indicating the uncertainty. The solid grey lines show the same relation with efficiencies of 1, while the dotted lines are obtained, from top to bottom, with efficiencies of 0.1, 0.01, 0.001, and 0.0001. Bottom row: summary of the best efficiency for our sample of galaxies, in the case of the atomic (left) and molecular (right) gas. The symbols are the same as in the top row. The red and dark red horizontal lines are the median ⟨ηatom⟩ and ⟨ηmol⟩ (also indicated above each panel) with 1σ error (grey area). Overall, the results of this “global” analysis are consistent with those obtained with the “spatially-resolved” approach, showing that low-efficiency SN feedback can sustain the gas turbulence.
Current usage metrics show cumulative count of Article Views (full-text article views including HTML views, PDF and ePub downloads, according to the available data) and Abstracts Views on Vision4Press platform.
Data correspond to usage on the plateform after 2015. The current usage metrics is available 48-96 hours after online publication and is updated daily on week days.
Initial download of the metrics may take a while.