Fig. 4.
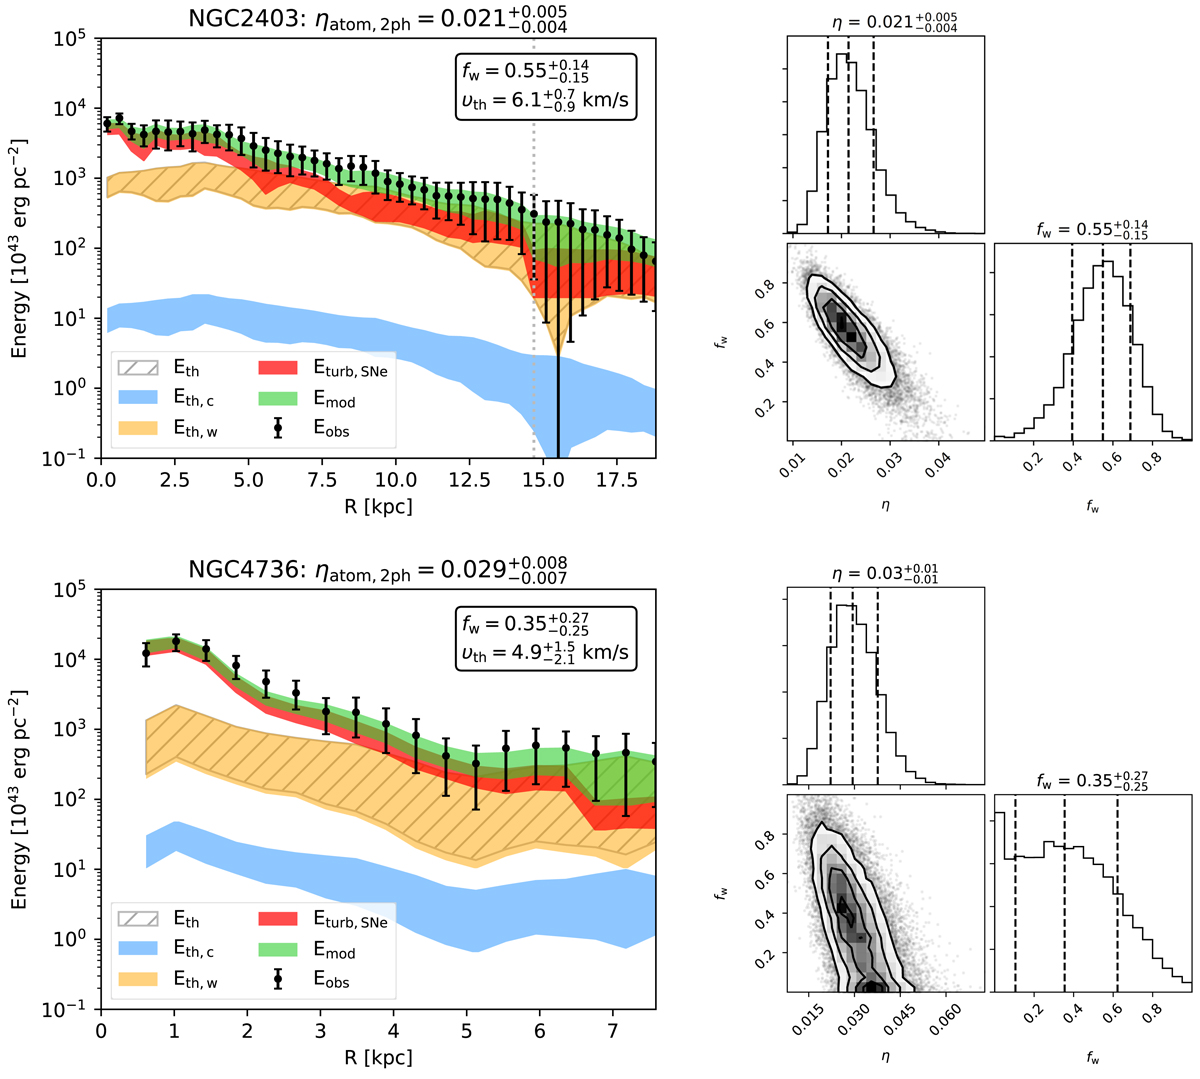
Left panels: observed kinetic energy per unit area of the atomic gas (black points; Eobs from Eq. (1)) for NGC 2403 (upper panel) and NGC 4736 (lower panel). The blue and the orange bands show respectively the thermal energy of the cold (Eth, c) and the warm (Eth, w) atomic gas. The green area is the total kinetic energy predicted by our best model (Emod; see also Appendix B), which includes the total thermal energy (grey dashed area; i.e. Eth from Eq. (11)) and the turbulent energy injected by SN feedback (red area; Eturb, SNe from Eq. (8)) with the best efficiency reported on top of the panel. The grey dotted vertical line indicates the outermost radius of NGC 2403 with measured ΣSFR, the upper limit is used for larger radii. The best fraction of WNM (fw) is reported in the top-right box, together with the corresponding thermal velocity of the atomic gas (Eq. (12)). The observed profile is very well reproduced by the theoretical energy of the best model. Right panels: corner plot showing the marginalised posterior distributions of the SN efficiency and the fraction of WNM fw. The best values with 1σ uncertainties are reported on top of each panel of the 1D posterior distribution.
Current usage metrics show cumulative count of Article Views (full-text article views including HTML views, PDF and ePub downloads, according to the available data) and Abstracts Views on Vision4Press platform.
Data correspond to usage on the plateform after 2015. The current usage metrics is available 48-96 hours after online publication and is updated daily on week days.
Initial download of the metrics may take a while.