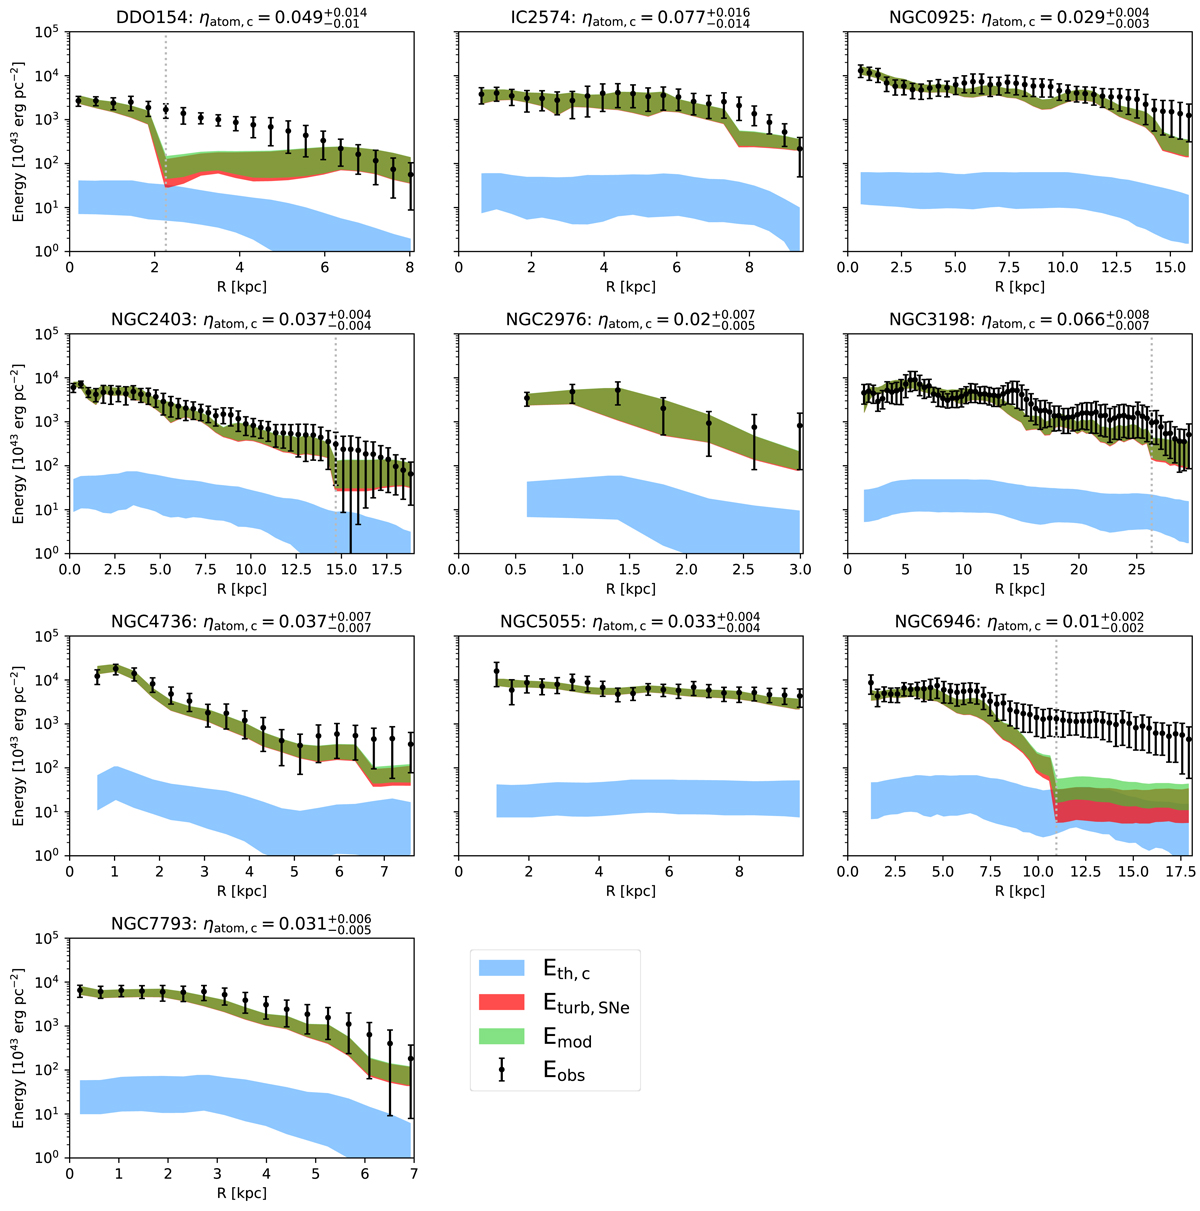
Fig. 2.

Observed kinetic energy per unit area of the atomic gas (black points) for our sample of galaxies (the errors are calculated with the uncertainty propagation rules applied to Eq. (1)). The blue area shows the thermal energy (Eth, c) of atomic gas if it is assumed to be only CNM. The red area is the turbulent energy injected by SNe (Eturb, SNe) with the efficiency ηatom, c reported on top of each panel. The green area represents the total energy (Emod) calculated as the sum of Eth, c and Eturb, SNe (see Sect. 3.2 and Appendix B). The observed profiles are well reproduced by the theoretical energy for almost all the galaxies. The grey dotted vertical line, when present, indicates the outermost radius with measured ΣSFR, hence the upper limit is used for larger radii.
Current usage metrics show cumulative count of Article Views (full-text article views including HTML views, PDF and ePub downloads, according to the available data) and Abstracts Views on Vision4Press platform.
Data correspond to usage on the plateform after 2015. The current usage metrics is available 48-96 hours after online publication and is updated daily on week days.
Initial download of the metrics may take a while.


