Free Access
Fig. A.8.
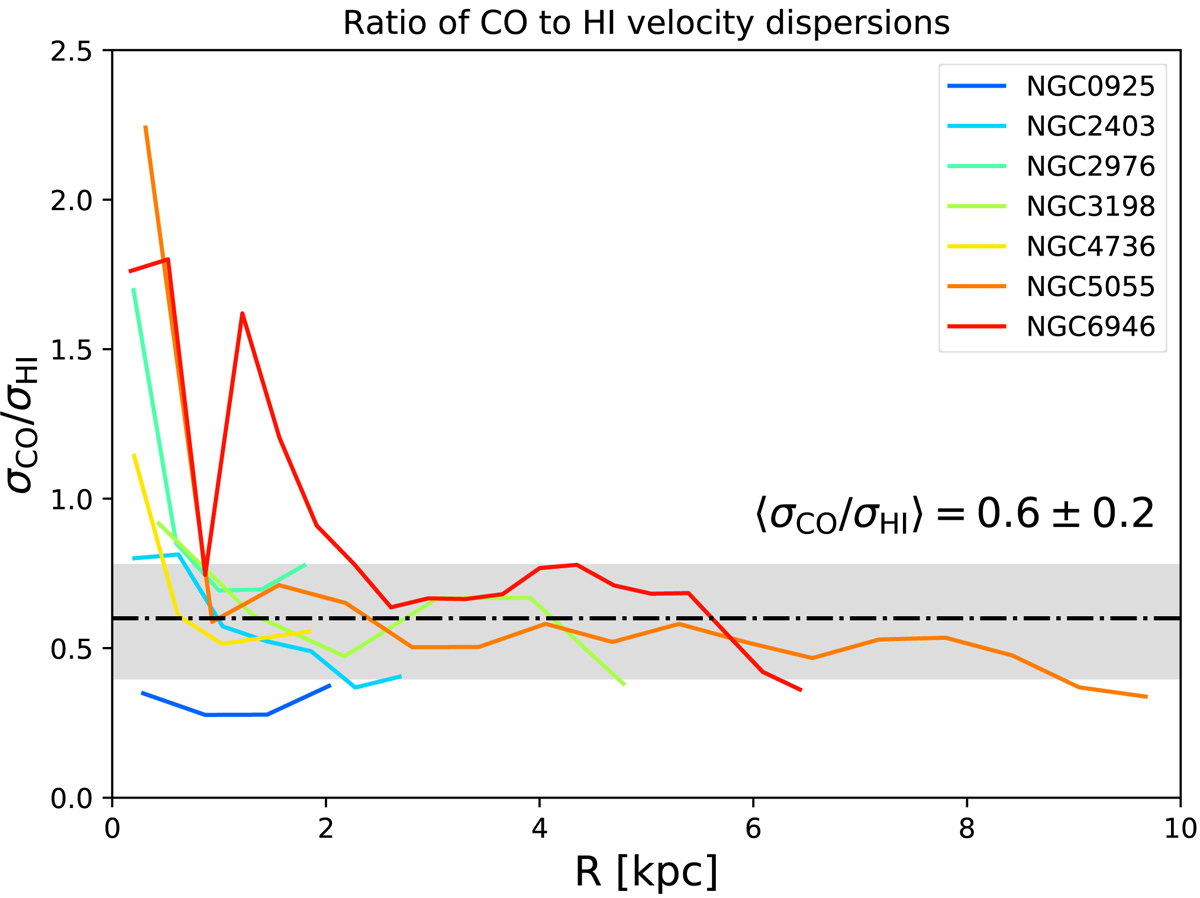
Ratio of the CO-to-HI velocity dispersion as a function of the galactocentric radius for the galaxies in our sample with CO detected. The median and the 84th and the 16th percentiles are represented by the dot-dashed black line and the grey area, respectively, and their values are reported above.
Current usage metrics show cumulative count of Article Views (full-text article views including HTML views, PDF and ePub downloads, according to the available data) and Abstracts Views on Vision4Press platform.
Data correspond to usage on the plateform after 2015. The current usage metrics is available 48-96 hours after online publication and is updated daily on week days.
Initial download of the metrics may take a while.