Fig. 16.
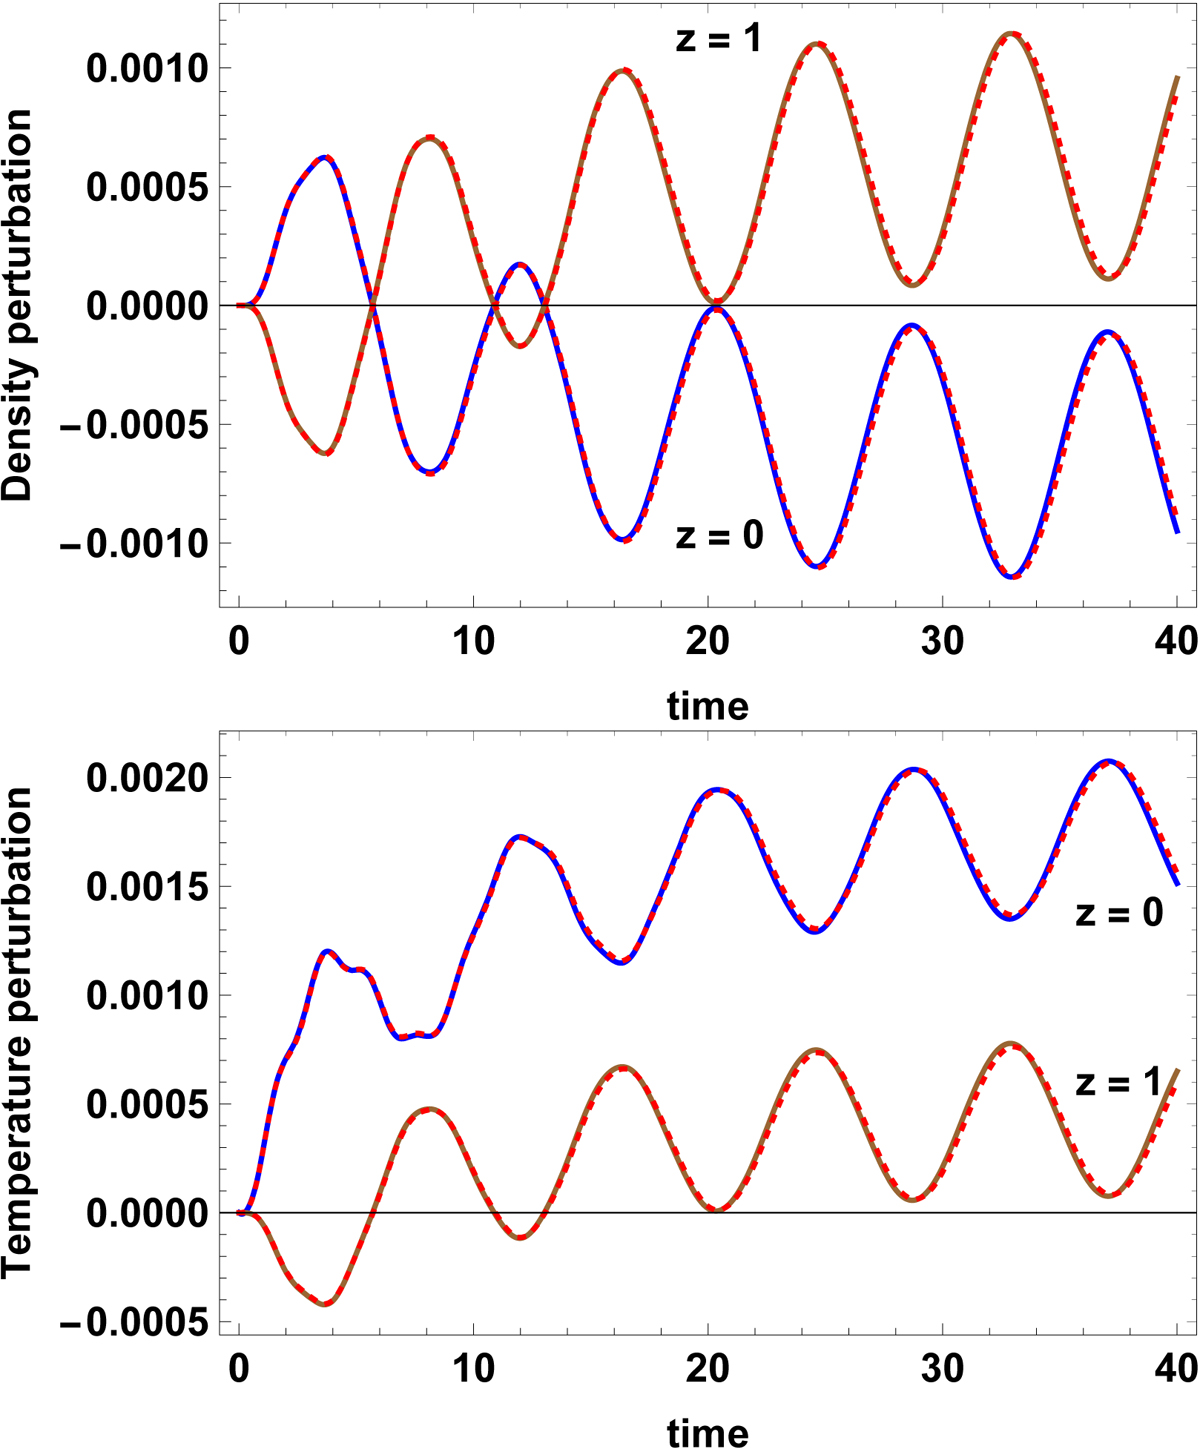
Density (top panel) and temperature (bottom panel) as a function of time at two different positions (z = 0 and z = 1) in the linear regime (v0 = 0.015). The continuous line corresponds to the purely numerical results while the dashed line represents the semi-analytical approach developed in the previous sections. In this case, ηc = 0.045.
Current usage metrics show cumulative count of Article Views (full-text article views including HTML views, PDF and ePub downloads, according to the available data) and Abstracts Views on Vision4Press platform.
Data correspond to usage on the plateform after 2015. The current usage metrics is available 48-96 hours after online publication and is updated daily on week days.
Initial download of the metrics may take a while.