| Issue |
A&A
Volume 641, September 2020
|
|
|---|---|---|
| Article Number | A159 | |
| Number of page(s) | 9 | |
| Section | Planets and planetary systems | |
| DOI | https://doi.org/10.1051/0004-6361/202038183 | |
| Published online | 24 September 2020 | |
Collisions between amorphous carbon nanoparticles: phase transformations
1
Physics Department and Research Center OPTIMAS, University Kaiserslautern,
Erwin-Schrödinger-Straße,
67663
Kaiserslautern,
Germany
e-mail: This email address is being protected from spambots. You need JavaScript enabled to view it.
2
Centro de Investigación DAiTA Lab, Facultad de Estudios Interdisciplinarios, Universidad Mayor,
Santiago,
Chile
3
Center for the Development of Nanoscience and Nanotechnology CEDENNA,
Avda. Ecuador 3493,
Santiago
9170124,
Chile
4
Centro de Nanotecnología Aplicada, Facultad de Ciencias, Universidad Mayor,
Santiago
8580745,
Chile
5
CONICET and Facultad de Ingeniería, Universidad de Mendoza,
Mendoza
5500,
Argentina
Received:
16
April
2020
Accepted:
29
July
2020
Abstract
Context. Collisions of nanoparticles (NPs) occur in dust clouds and protoplanetary disks.
Aims. Sticking collisions lead to the growth of NPs, in contrast to bouncing or even fragmentation events and we aim to explore these processes in amorphous carbon NPs.
Methods. Using molecular-dynamics simulations, we studied central collisions between amorphous carbon NPs that had radii in the range of 6.5–20 nm and velocities of 100–3000 m s−1, and with varying sp3 content (20–55%).
Results. We find that the collisions are always sticking. The contact radius formed surpasses the estimate provided by the traditional Johnson-Kendall-Roberts model, pointing at the dominant influence of attractive forces between the NPs. Plasticity occurs via shear-transformation zones. In addition, we find bond rearrangements in the collision zone. Low-sp3 material (sp3 ≤ 40%) is compressed to sp3 > 50%. On the other hand, for the highest sp3 fraction, 55%, graphitization starts in the collision zone leading to low-density and even porous material.
Conclusions. Collisions of amorphous carbon NPs lead to an increased porosity, atomic surface roughness, and changed hybridization that affect the mechanical and optical properties of the collided NPs.
Key words: planets and satellites: formation / protoplanetary disks / methods: numerical
© ESO 2020
1 Introduction
Besides silicates, SiC, and carbonates, carbonaceous material is thought to form the bulk of interstellar dust grains (Draine 2003; Tielens 2005). This carbonaceous material may appear in various forms, including diamonds, graphite, amorphous carbon (a-C), hydrogenated amorphous carbon, polycyclic aromatic hydrocarbons (PAHs), and aliphatic hydrocarbons. Fullerenes are among the smallest carbonaceous grains found in the space environment (Dimitrijevic 2005; Tielens 2008; Micelotta et al. 2012), but the size distribution of the analogous PAC (polycyclic aromatic carbons) is expected to follow a slowly decaying power-law distribution (Mathis et al. 1977; Tielens 2005). The existence of diamonds may be the most interesting, since diamond is not the ground-state, but a high-pressure allotrope of carbon. Nanodiamonds are found in meteorites with mean sizes of around 2.6 nm (Lewis et al. 1989) and are thought to be of presolar origin due to the unusual Xe and Te isotopic ratios they contain. However, Dai et al. (2002) argue that nanodiamonds may have formed in the inner Solar System, since they are absent in comets. Nittler (2003) reviews stardust found in meteorites and also reports – besides diamond – graphitic contributions with larger sizes, 1–20 μm. Vis et al. (2002) report besides diamond and graphitic structures, “black” carbon spheres, which may be amorphous or onions; in addition, hollow carbon structures – “sacs” or calabashes (Wang & Yin 1998) – are observed, which may serve as containers of noble gases.
Nanodiamonds may have formed by a condensation process akin to chemical vapor deposition in space (Nuth 1987; Abdu et al. 2018), or by energetic collisions of precursor material. Thus, Tielens et al. (1987) argued that grain–grain collisions of graphitic carbon grains may lead to diamond formation, even though graphitic material may be rare (Wickramasinghe et al. 1999). The pertinent high collision velocities are attained, for instance, in the shock waves generated by supernova explosions, but also during the impact of asteroids on planets. While true carbon stars, in whose environment hydrocarbon molecules are abundant, are rare, stars like Elias 1 (V 892 Tau) are known to emit, besides PAHs, also nanodiamonds (Goto et al. 2009), which are thought to originate from initially graphitic material, onions for instance, under irradiation. This hypothesis was corroborated by molecular-dynamics simulations, which showed that collisions of carbon onions, which are multi-shell concentric fullerenes, may lead to diamond formation (Marks et al. 2012).
Molecular-dynamics (MD) simulations offer an intriguing route to study the consequences of nanoparticle (NP) collisions. In general, the collision behavior of NPs features a sticking regime at low velocities, followed by a bouncing regime where the kinetic collision energy allows the attractive surface forces to be surpassed; at even higher energies, strong energy dissipation by particle deformation and/or NP fragmentation again leads to the fusion of the colliding NPs (Kalweit & Drikakis 2006; Ohnishi et al. 2008; Tanaka et al. 2012; Millán et al. 2016a,b; Nietiadi et al. 2019). It has been shown that silica nanoparticles will stick during collisions at velocities that are not too high (Nietiadi et al. 2017b), owing to their high surface energy; when the surface is passivated by H atoms, the bouncing velocity is reduced by a factor of almost an order of magnitude (Nietiadi et al. 2020). Ice NPs, on the other hand, will stick at all collision velocities, since at higher velocities collision-induced melting lets them readily deform and prevents bouncing (Nietiadi et al. 2017a). In an astrophysical context, NP sticking is relevant since it leads to mass agglomeration and thus dust growth (Dominik & Tielens 1997).
Previous studies of carbonaceous NP collisions are rare. As mentioned above, Marks et al. (2012) showed diamond formation in the collision of carbon onions. Johnson et al. (2017) used ab-initio MD to study high-velocity (10 km s−1) collisions of diamond NPs resulting in NP fragmentation. Sun et al. (2015) used a rigid force field, in which the carbon conformation cannot change, to study energetic impacts of diamond and also of amorphous carbon (a-C) NPs; due to their use of a rigid force field, they could not detect phase transformations. Recently they extended their simulations using a more flexible potential (Tersoff 1988) and reported that in the velocity regime of 1–2 km s−1, a-C NPs of a radius of 2–5 nm will bounce (Sun et al. 2020).
An understanding of the mechanical properties of a-C NPs is also relevant in other areas of science and technology. Liu et al. (2017) demonstrate that a-C nano-pillars show both high yield strength and large plasticity, which is interesting for their application in micro and/or nano-electro-mechanical systems (MEMS/NEMS; Suk et al. 2012). In addition, the combination of strength and flexibility (Yang et al. 2016, 2018) of amorphous, and also porous, carbon NPs helps to overcome the characteristic lack of ductility shown by a-C-based materials. These features are relevant for converting a-C NPs into promising candidates for protective coatings and also for the design of (H and Li) energy storage devices (Panella et al. 2005; Zhang et al. 2014).
In the present paper, we study energetic collisions between a-C NPs. Such NPs might easily have originated from the condensation of C-rich atmospheres around starsby the chemical-vapor-deposition processes mentioned above. The science of a-C is interesting since a continuum of variants exists that differ in the fraction of Catoms bonded in sp2 or sp3 bonds. We therefore create a-C specimens with a sp3 fraction between 20 and 55%. We study how energetic collisions between such a-C NPs change the sp3 fraction andhence the physical and chemical properties of the NPs.
For computational reasons, our study focuses on small nanometer-sized grains with radii ≤ 20 nm, and on central collisions. It is therefore not comprehensive, but aims at showing which phenomena show up in this collision system that have not been encountered before in the better understood silica-grain collisions. We thus direct attention to the phase transformations induced in carbon-grain collisions that alter the mechanical properties (elastic moduli and surface energies) of the grains. These alterations need to be taken into account when attempting to set up a database to be used to model the size evolution of carbon dust clouds, similar to the work of Ormel et al. (2009) for ice and silica grains. Since the sp3 content also influences the optical properties of NPs (Koike et al. 1980; Zubko et al. 1996; Hiratsuka et al. 2013), the collision history of grains influences their refractive indices and extinction coefficients.
2 Method
There are many interatomic interaction potentials to describe the C–C interaction, as described, for instance, in the comparative reviews by de Tomas et al. (2016, 2019). Here we used the environment-dependent interaction potential (EDIP) for carbon designed by Marks (2000). It is well suited to describe the diamond-graphite transition, and was shown to fare well in describing a-C (de Tomas et al. 2016, 2019).
The a-C samples are prepared by quenching liquid carbon, based on the procedures of Marks et al. (2002) and de Tomas et al. (2016). A total of 473 344 C atoms are ordered in a simple cubic structure in a 82a0 × 82a0 × 42a0 supercell with a lattice parameter a0. The lattice constant a0 is treated as a free parameter to control the a-C density. The crystal is quickly heated to 5000 K with a heating rate of 104 K ps−1 by means of a velocity scaling algorithm. Then the liquid carbon is quenched from 5000 to 300 K in 0.5 ps using an exponential cooling rate. The fast cooling rate ensures that the liquid carbon solidifies in an amorphous structure. Finally, the sample is kept at 300 K for 50 ps to allow system relaxation and bond rearrangements. The sp3 content of each sample is characterized using the pair correlation function with a cut off of 2.0 Å. The a-C specimens contain sp3 fractions of sp3 = 20, 30, 40, and 55%, and we denote the sp3 fraction in our specimen by sp3. The densities obtained (see Table 1) are in good agreement with experimental results and density-function-theory calculations (Schwan et al. 1996; Marks et al. 2002; de Tomas et al. 2016, 2019). We note that inprevious studies, several many-body potentials have been employed for a-C modeling; however, not all of them have demonstrated good results in reproducing the a-C density, microstructure, and the sp3 content simultaneously (Li et al. 2013a, 2018). However, the EDIP potential, with the quenching method employed here, has been shown to give reliable results if compared to experimental evidence and first-principles calculations (Marks et al. 2002).
Young’s modulus, E, is an important parameter to describe the collision mechanics; we determine it from a uniaxial loading simulation at a strain rate of 1.0 × 10⁻⁸ s−1 up to a final strain of 0.01. In general, for a-C, the dependence of E on sp3 is highly sensitive to the interatomic potential (Jana et al. 2019). From the so-called constraint model of covalent glasses proposed byHe & Thorpe (1985), we know that the a-C Young’s modulus increases with the average coordination ⟨Z⟩ as
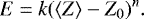 (1)
(1)
Here, Z0 marks the transition from a floppy to arigid network and k and n are fit parameters. We determine ⟨Z⟩ from the atomistic data; our results (see Table 1) successfully fulfill the dependence ⟨Z⟩ = 3 + sp3 predicted by Ferrari et al. (1999b), in particularfor higher sp3 fractions.
Our a-C specimens fulfill Eq. (1) with fit factors Z0 = 2.4, k = 443.69 GPa, and n = 1.54, in good agreement with the value n = 1.5 of the model (He & Thorpe 1985). Besides, our EDIP results extrapolate to a Young’s modulus of 915 GPa for a fully coordinated network (⟨Z⟩ = 4), which is only slightly smaller than that of diamond (~1000 GPa), as expected due to the amorphous structure of a-C. Additionally, the model achieves good agreement with the available experimental results of tetrahedral a-C (Kelires 1994; Ferrari et al. 1999b; Charitidis 2010).
The specific surface energies γ were calculated by the usual procedure (Wolf 1990), which consists in comparing the potential energy of bulk material with that of material containing a planar surface. Our values (see Table 1) show a clear increase of γ with sp3 fraction. As a comparison, for graphite it is γ = 0.1 J m−2 (Li et al. 2013b), while in diamond – depending on the surface orientation – γ may reach 4 J m−2 (Kern & Hafner 1997; De La Pierre et al. 2014). This strong dependence on sp3 fraction is in line with the notion that available dangling bonds at a surface increase the specific surface energy. We note that surface passivation would strongly change γ; in the comparable case of silica NPs, surface passivation lets the surface energy decrease from 1.43 to 0.08 J m−2 (Nietiadi et al. 2017b, 2020).
For preparation of the NPs, we replicate the cuboid samples and cut out spheres of a predefined radius R. For radius R = 6.5 (10, 15, 20) nm, each NP contained between N = 123, 380 and 5 040 403 C atoms; the exact numbers for each sp3 fraction are provided in Table 2. The spheres are relaxed for 50 ps in an NPT environment, cooling their temperatures to below 1 K, and relaxing the internal pressure to zero. Since during this process the NP surface exhibited atomistic roughness, atoms sticking out by more than 3.4 Å were removed.
To perform collision simulations, the NPs were copied and put at a distance of 2 nm, outside the cut-off radius of the potential (see Fig. 1a). Then the two NPs were given a relative velocity v to start the collision. Only central (head-on) collisions were considered. The simulations were followed for 40 ps. The MD simulations were performed with the LAMMPS code (Plimpton 1995). Atomistic snapshots were generated with OVITO (Stukowski 2010).
Number N of C atoms in a NP of radius R and sp3 fraction sp3.
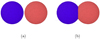 |
Fig. 1 Snapshots showing the (a) initial and (b) final conformation of two R = 20 nm NPs, sp3 = 20% at a velocity of v = 600 m s−1. Atoms are colored according to their original grain affiliation. |
3 Results
3.1 Contact radius
In all cases studied – radii up to R = 20 nm, velocities between 100 and 3000 m s−1, and for all sp3 fractions – we only observed sticking; the two NPs never bounced off each other. A typical result of the sticking is shown in Fig. 1b for the specific case of sp3 = 20%, R = 20 nm, and v = 600 m s−1. Due to the high collision energy, a few weakly bound C atoms are shattered off the surface. In the contact zone, some intermixing of grain material canbe observed on an atomic scale. The radius of the approximately circular contact zone is denoted as the contact radius, ac ; it is here approximately 11.8 nm, around 60% of the NP radius R.
For the sp3 = 55% NPs, the same collision conditions lead to a quite different contact zone (see Fig. 2). During the compressive phase of the collision (Figs. 2b and c) the contact looks similar to the sp3 = 20% case (Fig. 2). However, later, when the two NPs expand again and attempt to lose their contact, the contact zone expands along the collision apsis, but the two NPs stay connected by a multitude of filaments. These mostly consist of C material stemming from a single grain that is elongated along the tearing direction. This is the only case observed by us that comes close to bouncing; we note, however, that the NPs never separate. We checked the collision zone in particular for velocities between 200 and 800 m s−1; in all these cases the filamentary fuzzy structure developed, as in Fig. 2; of course, in accordance with the increase of the contact radius with velocity, the radial size of this filamentary structure also increased.
Similar monoatomic filaments were observed in previous simulations of silica NP collisions (Nietiadi et al. 2017b). For that material, however, the filaments could rupture at sufficiently high collision velocities. In C material, diamond NP collisions (Johnson et al. 2017), tension tests of C nanotubes (Liew et al. 2004), and the fracture of graphene grain boundaries (Zhang et al. 2013)led to monoatomic filaments similar to the ones observed here.
The dynamics of the contact is given – besides the contact radius – by the time evolution of the overlap δ. It is defined by the difference of the distance d between the centers of the two NPs and 2R, δ = 2R − d; positive overlap thusmeans a compressive deformation of the two NPs. In Fig. 3 we plot the overlap and contact radius of the two collisions shown in the snapshots of Figs. 1 and 2. During the early part of the compressive phase – until time t = 5 ps with overlaps of around 4 nm and contact radii of 8 nm – both collisions are quite similar. However, later significant differences show up. The sp3 = 20% case leads to further compression with a maximum at 11 ps where δ reaches almost 8 nm, followed by a series of oscillations of the collided NP pair, which slowly dampens its amplitude. The contact radius stabilizes its size of 11.8 nm after the time of strongest depression; even during the NP oscillations the contact radius stays constant, thus proving the attractive strength of the contact.
The sp3 = 55% case shows a smaller maximum overlap of only 5 nm, which points at a larger stiffness of the sp3 = 55% a-C material. During the ensuing expansion phase, the overlap reaches negative values after around 18 ps; this means that the NPs are farther apart than 2R; this is the phase where the filamented neck forms between the two NPs, which is seen in Figs. 2e and f. The buildup of the neck dampens the NP oscillations. The contact radius does not quite reach the size of the sp3 = 20% case and has a maximum of 10 nm; it slowly decreases to only 8.5 nm while the overlap becomes negative.
In Fig. 4, we investigate to what extent the collision velocity influences the features described in Fig. 3b. It is observed that with increasing collision velocity, the contact radius increases (see Fig. 4) but the features mentioned above, remain analogous.
The time dependence of the contact radius may be further analyzed by appealing to the Johnson-Kendall-Roberts (JKR, Johnson et al. 1971) theory of adhesive contacts. It predicts a relation between the overlap δ and the contact radius ac – which we denote here as aJKR to emphasize its derivation from JKR theory – as (Maugis 2000; Brilliantov et al. 2007)
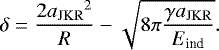 (2)
(2)
Here, γ is the specific surface energy and Eind = E∕(1 − ν2) is the indentation modulus, where E is Young’s modulus and ν is the Poisson ratio. As theinfluence of ν is small, we set Eind ≃ E.
We use Eq. (2) to determine from our data of δ(t) a corresponding contact radius via Eq. (2), which we denote as aJKR, and compare to our simulated data of the contact radius, ac (see Fig. 5). Indeed, the rising part of the contact radius is quite well reproduced by the JKR theory. However, the contact radius at maximum compression is underestimated, and the behavior during the oscillatory motion in the sp3 = 20% case, and even more during the NP expansion in the sp3 = 55% case, is not reproduced at all. This shows that the role of the attractive forces between the two NPs is not well reproduced by JKR theory.A similar failure of JKR was noticed previously in the collision of silica NPs (Nietiadi et al. 2017b), and even more so in the collision of ice NPs (Nietiadi et al. 2017a).
Johnson-Kendall-Roberts theory also allows us to extract a prediction of the bouncing velocity, vb, which is the smallest velocity at which two NPs bounce. It is given by (Thornton & Ning 1998; Brilliantov et al. 2007; Krijt et al. 2013)
 (3)
(3)
Here, ρ is the mass density and C is a constant that incorporates dissipative processes during the collision. A wide range of values – from C = 5.25 (Brilliantov et al. 2007) over 18.3 (Dominik & Tielens 1997) and 57.9 (Kimura et al. 2015) to 669 (Nietiadi et al. 2017b) – has been used for this constant. Using the highest value of C, the bouncing velocity of R = 20 nm spheres is predicted by Eq. (3) to be between 776 m s−1 for sp3 = 20% and 595 m s−1 for sp3 = 55%. The mild decrease with sp3 content is due to the fact that the surface energy only increases weakly, while both density and elastic modulus increase more strongly with sp3 content (see Table 1).
In our simulations, we do not find bouncing for these velocities (nor for any other velocity in the range investigated). However, in the velocity range of 600–800 m s−1, we do find the formation of the filamentary adhesive neck (see Fig. 2), which is induced when during the attempted separation of the two NPs after the collision, hybridization changes in the bonding prevent bouncing. So the velocity regime of 600–800 m s−1 comes closest to the bouncing case. We conclude that the role of attractive forces in the collision of a-C NPs is larger than anticipated in macroscopic theories, like JKR or even the Derjaguin-Muller-Toporov (DMT) model (Derjaguin et al. 1975), where attractive van-der-Waals forces are included. Therefore, nanoscopic a-C NPs do not bounce.
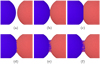 |
Fig. 2 Snapshots showing a collision of two R = 20 nm NPs, sp3 = 55% at a velocity of v = 600 m s−1, at (a) the start of the simulation, 0 ps, (b) jump to contact, 2 ps, (c) the moment of maximum compression, 8 ps, and during the expansion regime at times of (d) 15 ps, (e) 20 ps, and (f) 40 ps. Atoms are colored according to their original grain affiliation. |
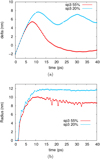 |
Fig. 3 Time evolution of the (a) overlap, δ, and (b) contact radius, ac, in the collision of two NPs of radius R = 20 nm colliding with velocity v = 600 m s−1. Data are for two sp3 fractions, sp3 = 20 and 55%. |
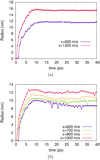 |
Fig. 4 Time evolution of the contact radius, ac, in the collision of two NPs of radius R = 20 nm, for an sp3 fraction of (a) sp3 = 20% and (b) sp3 = 55%, colliding with various velocities v. |
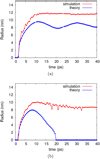 |
Fig. 5 Time evolution of the contact radius, ac, in the collision of two NPs of radius R = 20 nm, colliding with velocity v = 600 m s−1 for sp3 fractions of (a) sp3 = 20% and (b) sp3 = 55%. The simulation results are compared to the estimate of JKR theory, Eq. (2). |
3.2 Collision-induced phase transformation
We monitor the bonding in the collision zone in the final state by the sp3 fraction. To be specific, besides an analysis in the entire system, we performed the analysis in a slab centered in the collision plane (mid-plane between the two spheres, perpendicular to the collision apsis) with a fixed width of 4 nm, thus extending 2 nm into each of the two colliding NPs. We note that the grain-averaged data show the same trends as the data obtained in the slab, but naturally exhibit smaller collision-induced changes. Atoms are classified according to the number of nearest neighbors, Z; atoms with Z = 2 (3, 4) are sp1 (sp2, sp3) bonded.
During the collision, the sp3 content significantly changes. Figure 6 shows the changes in the collision zone for R = 20 nm NPs as a function of collision velocity. For low sp3 content (sp3 = 20–40%), Fig. 6a shows an increase of sp3 content for velocitiesbelow 1000 m s−1. In the collision zone, the sp3 fraction increased up to almost 50–55%. This process is akin to the phase transformation from graphite to diamond occurring at high pressures and is caused by the collision-induced compression, which increases the number of nearest neighbors, and hence the sp3 fraction.
For larger velocities, the sp3 fraction decreases again. We presume that this is caused by the high temperature building up in the collision zone. It is known that for temperatures above around 800–900 K, a-C shows a stress release and softening that is accompanied by bond rearrangements (Ferrari et al. 1999a). Indeed our simulations show that temperatures increase with velocity in the collision zone and reach values above this threshold (see Sect. 3.3 below). In addition to these thermal effects, at higher velocities more energy is lost to elastic waves that are emitted from the contact zone so the energy density at the interface is lower when integrated over the few picoseconds where compaction occurs. We note that when averaged over the entire system, the sp3 fraction shows only a mild, but continuous, increase with velocity, from 21 to 30% for the sp3 = 20% system, and from 41 to 44% for the sp3 = 40% NPs.
For the sp3 = 55% NPs, however, the collision reduces the sp3 fraction (see Fig. 6b). Since this phenomenon is opposite to that found in the sp3 -poor samples, we increased the velocity range where we monitored the collision zone for this case. At small velocities, v ≤ 700 m s−1, the sp3 fraction continually decreases. As discussed in Sect. 3.1, the origin of the low sp3 fraction in the collision zone is the adhesive glue-like zone arising from the attractive forces holding the two NPs together (see Fig. 2 above and its discussion). Indeed, a closer look at the collision zone shows graphitic structures that have developed (see Fig. 7) and also linear (sp1 -bonded) chains. We may therefore term this process graphitization. For larger velocities, up to 1500 m s−1, the sp3 fraction increases again; this is caused by the increasingly high compressive pressure, which does not allow the formation of the low-coordinated adhesive neck (see Fig. 8). For even larger velocities, the sp3 fraction is reduced again; this case will be discussed in Sect. 3.4 below.
When averaged over the entire sp3 = 55% system, the sp3 fraction stays roughly constant at around 53–55% up to a velocity of v = 1500 km s−1, demonstrating that the collision-induced hybridization changes only affect a small volume within the collision zone. At 3000 m s−1, however, the averaged sp3 fraction sinks to only 40% (see Sect. 3.4).
Figure 9 shows how these results depend on the NP radius. For the low-sp3 specimens, sp3 = 20–40%, the rise of the sp3 fraction with velocity is qualitatively similar, but not so pronounced as for the case of the large R = 20 nm spheres. In particular the sp3 = 20% NPs with radius R = 6.5 nm show considerably less tendency to form sp3 bonds, reaching post-collision values of only 36–40%. The sp3 = 55% NPs also show a strong reduction in changing their hybridization in the small NPs; in the R = 6.5 nm NPs, their sp3 fraction always stays above 43%. The stronger effect in the larger NPs may be connected to the fact that the time during which the large compression lasts is roughly proportional to R, according tosimple Hertz theory (Johnson 1985, Eq. (11.24)). Thus, in larger NPs, there is more time for the phase transformation to occur. On the other hand, we must also bear in mind that the true collision zone becomes smaller for smaller NP radii, while our analysis slab of 4 nm width has been kept unchanged. We note that even in these small spheres, the sp3 fraction shows a minimum at a velocity of 700 m s−1, showing that the formation of the filamentary adhesive neck also persists for these smaller NPs.
The unusual behavior of sp3 = 55% NPs at a collision velocity of v = 700 m s−1 is emphasized in Fig. 10; at this velocity, NPs of all radii studied have the lowest sp3 fraction in the collision zone, indicating the formation of a strong filamentary neck. In addition, this figure shows that larger NPs lose more sp3 bonds in their collision zone, as their neck becomes broader with increasing NP radius R.
We can estimate the pressure p arising during compression in the collision zone as follows. From the Hugoniot relationship we may derive the simple approximation (Millán et al. 2016a)
 (4)
(4)
where  is the velocity of sound, which increases with sp3 content (Table 1). We evaluate Eq. (4) for a collision velocity of v = 600 m s−1. Since both the density and the velocity of sound increase with sp3, a strong increase in the collision-induced pressure p with sp3 content is the result (see Table 1).
The pressures estimated above for this collision velocity are much smaller than the elastic limits for pure diamond (around 150 GPa Oleynik et al. 2008), and pure graphite (around 65 GPa and 2 km s−1 piston velocity Pineau 2013). For a-C, using the Tersoff potential it was found that, for initial densities above 2.38 g cm−3, the shock behavior was elastic, until chemical changes started above 65 GPa (Reed et al. 2010, Fig 6a). On the other hand, our pressure values of 12–25 GPa are in the range of the experimental data for the phase transition from graphite to diamond in C, which is on the order of 20 GPa for defective materials, but higher for ideal crystals (Pineau 2013; Pineau et al. 2015). We conclude that the compressive pressures achieved during the collision are sufficient to trigger phase transformations in our NPs.
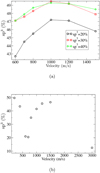 |
Fig. 6 Dependence of sp3 fraction in the contact region on collision velocity v. Data are for R = 20 nm NPs with (a) various initial sp3 fractions (see legend) and (b) for sp3 = 55%. |
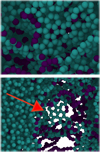 |
Fig. 7 Graphitic structures generated in the collision zone of two R = 20 nm NPs of sp3 = 55% at velocity v = 800 m s−1. Atoms are colored according to their bonding configuration: green (sp2), blue (sp1). |
 |
Fig. 8 Snapshots showing the final conformation of two R = 20 nm NPs, sp3 = 55%, at the collision velocities indicated. Atoms are colored according to their bonding configuration. |
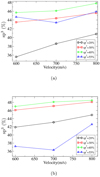 |
Fig. 9 Dependence of sp3 fraction in the contact region on collision velocity v for NPs of radius (a) 6.5 nm and (b) 15 nm. |
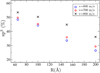 |
Fig. 10 Dependence of final sp3 fraction in the contact region on NP radius R for NPs withsp3 = 55% for various collision velocities. |
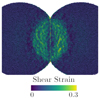 |
Fig. 11 Snapshots showing the conformation of two R = 20 nm NPs, sp3 = 20%, at a collision velocity of v = 800 m s−1, immediatelyafter maximum compression. Atoms are colored according to their shear strain. |
3.3 Materials behavior
Figure 11 illustrates the plastic deformation occurring in a collision of two sp3 = 20% NPs, R = 20 nm, at a collision velocity of v = 800 m s−1, immediatelyafter maximum compression. Here, atoms are colored according to the strain they suffered during the collision. The strained region defines a quite clearly identifiable zone, which is of nearly spherical shape around the center of the contact plane with radius ac. Interestingly, this zone is not homogeneously sheared, but the highest shears appear in narrow regions, indicating the occurrence of localized shear transformation zones (STZs). Such STZs are known to govern the plastic deformation of amorphous material (Falk & Langer 1998; Schuh & Lund 2003; Huang et al. 2013); they were previously shown also to appear in energetic collisions of amorphous silica NPs (Nietiadi et al. 2017b). Here is the first time that their relevance is also demonstrated in a-C NP collisions. Their appearance may be significant for the future mechanical behavior of collided NPs since the material has been softened in these STZs, which might therefore be more susceptible to future cracking.
During collision, the temperature may reach high values in the collision zone. As an example, we obtained values of 3200 K at the time of maximum compression for sp3 = 20% NPs with radius R = 20 nm colliding with a velocity of v = 800 m s−1. This high temperature is induced by the work done in the compression of the NPs. For sp3 = 55% NPs under the same collision conditions, the temperature is considerably smaller (1700 K) in agreement with the larger bulk modulus of this specimen.
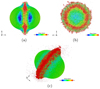 |
Fig. 12 Snapshots of the final configuration of two R = 20 nm NPs of sp3 = 55% colliding with a velocity of v = 3000 m s−1. Cross-sectional view (a) parallel and (b) perpendicular to the collision axis. (c) Perspective view. Atoms are colored according to their shear strain. |
3.4 High-velocity collision
We also studied a collision at a high velocity, v = 3 km s−1. This was done for sp3 = 55% NPs of radius R = 20 nm. Figure 12 shows the final conformation of the merged NPs. The material in the contact plane expanded to form a bulge between the two merged NPs. We note that an increase in the contact radius beyond the values predicted by JKR was already visible at collision velocities of 600 m s−1 (see Fig. 5). This process has now become even more pronounced. It may be assumed that the high temperatures reached in the collision zone allowed for the material to expand so significantly.
The side view (Fig. 12a) confirms that the major strain occurred around the contact plane and in the bulge. However, the entire material underwent strains of around 0.25, simply because the two spheres collapsed upon merging. The axial view (Fig. 12b) shows how strain monotonically increases from the collision axis toward the forming bulge. In allpanels shown in Fig. 12, low-density material can be seen that has formed at the bulge.
We show a zoom in on this material in Fig. 13. Clearly, the emergence of several varieties of graphitic structures can be observed. These structures are very open, leaving room between them that make the structure very porous. It is known that high porosities change the behavior of NPs drastically in several respects, such as the thermal response (Okamoto et al. 1994)and also the dielectric constant (Mukai et al. 1992).
The strong roughening of the surface enhances the surface area of the merged NP. This may have consequences in a space environmentfor catalytic processes occurring on the surface and also for gas adsorption (Li & Greenberg 2000). The rim of material coming out of the central collision zone is similar to the rim observed in the collision of diamond nanoparticles, 3 nm diameter, at 10 km s−1, simulated with ab-initio MD (Johnson et al. 2017). High shear and high temperature has been suggested as the cause of long linear carbon chains at the collision interface, somewhat akin to the collision scenario here at significantly lower velocities, but for a softer material.
Particle ejection becomes a major process at these high velocities (see Fig. 12c). A total of 80 000 atoms – corresponding to 0.8% of the total material – have been ejected. Many of them appear in the form of clusters. Several of them can be spotted in Fig. 13. These are mainly based on graphitic material and may be denoted as PACs. The largest PAC contained 610 atoms.
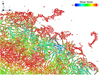 |
Fig. 13 Graphitic structures generated in the collision of two R = 20 nm NPs of sp3 = 55%. Zoom in on the collision-induced bulge created at a velocity of v = 3000 m s−1. Atoms are colored according to their shear strain. |
3.5 Discussion
Light scattering from nanoparticles usually assumes several simplifications, like homogeneity and the fact that a dielectric function can be assigned to the whole nanoparticle. Some approaches for nanoparticles of up to a few nanometers assume only graphitic-like structures with up to a few thousand atoms (Li & Draine 2001). In our simulations, for nanoparticles with few million atoms, the collision generates large inhomogeneities in chemical bonding inside the nanoparticle, and obtaining the resulting spectra would be difficult, because neither the quantum-based spectroscopy methods available for relatively few atoms, nor the continuum approaches used for μm-sized particles could be used.
Granular-mechanics approaches have been often used to describe granular collisions. These microscopic approaches can be useful (Krijt et al. 2013), but due to their formulation they cannot describe changes in the internal structure of the grains, such as those found here, where bonding modifications inside the nanoparticles affect energy dissipation and sticking.
While the present study focuses on velocities of a few hundred meters per second and NP radii of at most 20 nm, the collision outcome of carbon NPs at smaller velocities and larger radii will also be interesting for astrophysical applications. In analogy to other materials studied, it may be inferred that lower velocities would lead to sticking, and eventually would lead to sticking without significant chemical change; such collisions thus lead to trivial results. The simulation of larger NPs, on the other hand, is nowadays hardly possible due to the computational cost of using reactive interatomic potentials; actually, the simulations presented in this study are already pushing the limits of NP sizes that are possible with these simulations in mid-size computational clusters. However, we would speculate that larger aC NPs will behave similarly to the ones simulated here with respect to their phase transformation behavior, with plasticity appearing at even lower collision velocities (Millán et al. 2016b).
4 Conclusions
We employed MD simulations to study the effects of the collisions of a-C NPs. Our findings are for bare NPs as they might be found in space in the vicinity of a star where temperatures are so high as to let all adsorbates desorb. We find the following features.
- 1.
In the velocity regime of 100–3000 m s−1, the collisions are always sticking. This is caused by the high density of dangling bonds at the surface, which produce a high surface energy. The correspondingly high attraction force prevents bouncing. As a consequence, carbon dust has a short collision-induced agglomeration time, since fragmentation events are missing.
- 2.
In addition, the material phase transforms in the collision zone by converting sp2 to sp3 material. This occurs for sp3-poor material (sp3 ≤ 40%) and produces material with sp3 > 50%. This process occurs during the collision-induced compression, which locally increases the coordination number and hence the sp3 content.The process is akin to the pressure-induced phase transformation from graphite to diamond. Such hybridization changes are bound to change the IR spectra of NPs.
- 3.
Only for the highest sp3 fraction, 55%, is a different behavior observed, since there – immediately at the contact surface – sp1 filamentsand sp2 graphitic sheets are produced. This process of “graphitization” occurs in the expanding phase of the collision; the resultingmaterial acts as a glue to keep the NPs contacted.
- 4.
Macroscopic JKR theory describes the ingoing trajectory of the two colliding grains. However, the contact radius reached at maximum compression is larger in the simulation than in JKR theory, pointing again to the dominant role of attractive intergranular forces.
- 5.
Apart from the importance of phase transformation, shear-transformation zones could be identified in the collision zone that are responsible for the NP plasticity.
- 6.
At the highest collision velocity studied, 3 km s−1, an intergranular bulge formed, which showed a high degree of graphitization, as well as porosity. These features, as well as the observed surface roughening, have consequences for the thermal and optical properties of the NPs, and also for their potential for gas adsorption and surface catalytic reactions. In addition, ejection of material from the NPs wasobserved, both in the form of atoms and PACs.
Passivation of the surface, for instance by adsorbed H, may have a strong effect on the collision behavior. For the analogous case of silica NP collisions, it was shown that surface passivation reduces the surface energy by around one order of magnitude (Kimura et al. 2015; Nietiadi et al. 2020). However, the simulation of collisions of surface-passivated or even hydrogenated a-C NPs is not straightforward, since a reliable interatomic potential, which represents both the C-H chemistry and the high-pressure phase transformations faithfully, does not appear to be available. The REAX potential (Srinivasan et al. 2015), which possibly best presents this option, is unfortunately computationally quite expensive.
The present study explored the phenomena occurring in carbon-grain collisions in a very restricted model scenario – limited size range in the nanometer range (R ≤ 20 nm), pure carbon with sp3 fractions between 20 and 55%, only central collisions – and can therefore not be considered as a comprehensive study. Rather it aims at exploring which phenomena may occur in this class of materials, which has up to now been little investigated. Indeed we find that (i) the sp3 fraction is an important material quantity that dictates the elastic and adhesive properties of the grains; (ii) collisions induce phase transformations in the grain that alter their properties. Collision-processed grains may have surface properties that differ from those with which they were generated. This not only applies to the mechanical properties, but may also affect the optical properties, since it is known that refractive indices and extinction coefficients of amorphous-carbon grains depend on their sp3 fraction (Koike et al. 1980; Zubko et al. 1996; Hiratsuka et al. 2013).
Acknowledgements
Collision simulations were performed at the High Performance Cluster Elwetritsch (Regionales Hochschulrechenzentrum, TU Kaiserslautern, Germany). We acknowledge financial support by the Deutsche Forschungsgemeinschaft within project Ur 32/27-2. F.V. and R.G. thank the Fondo Nacional de Investigaciones Científicas y Tecnológicas (FONDECYT, Chile) under grants #11190484, and #11180557, and Financiamiento Basal para Centros Científicos y Tecnológicos de Excelencia AFB180001. E.M.B. acknowledges funding from a SIIP-UNCuyo grant 06/M104. This research was partially supported by the supercomputing infrastructure of the NLHPC (ECM-02)
References
- Abdu, Y. A., Hawthorne, F. C., & Varela, M. E. 2018, ApJ, 856, L9 [CrossRef] [Google Scholar]
- Brilliantov, N. V., Albers, N., Spahn, F., & Pöschel, T. 2007, Phys. Rev. E, 76, 051302 [NASA ADS] [CrossRef] [Google Scholar]
- Charitidis, C. A. 2010, Int. J. Refract. Metals Hard Mater., 28, 51 [CrossRef] [Google Scholar]
- Dai, Z. R., Bradley, J. P., Joswiak, D. J., et al. 2002, Nature, 418, 157 [NASA ADS] [CrossRef] [PubMed] [Google Scholar]
- De La Pierre, M., Bruno, M., Manfredotti, C., et al. 2014, Mol. Phys., 112, 1030 [CrossRef] [Google Scholar]
- de Tomas, C., Suarez-Martinez, I., & Marks, N. A. 2016, Carbon, 109, 681 [CrossRef] [Google Scholar]
- de Tomas, C., Aghajamali, A., Jones, J. L., et al. 2019, Carbon, 155, 624 [CrossRef] [Google Scholar]
- Derjaguin, B. V., Muller, V. M., & Toporov, Y. P. 1975, J. Colloid Interface Sci., 53, 314 [Google Scholar]
- Dimitrijevic, M. S. 2005, Proc. IV Serbian-Bulgarian Astronomical Conference, eds. M. S. Dimitrijevic, V. Golev, L. C. Popovic, & M. Tsvetkov, 51 [Google Scholar]
- Dominik, C., & Tielens, A. G. G. M. 1997, ApJ, 480, 647 [NASA ADS] [CrossRef] [Google Scholar]
- Draine, B. T. 2003, Annu. Rev. Astron. Astrophys., 41, 241 [Google Scholar]
- Falk, M. L., & Langer, J. S. 1998, Phys. Rev. E, 57, 7192 [CrossRef] [Google Scholar]
- Ferrari, A. C., Kleinsorge, B., Morrison, N. A., et al. 1999a, J. Appl. Phys., 85, 7191 [CrossRef] [Google Scholar]
- Ferrari, A. C., Robertson, J., Beghi, M. G., et al. 1999b, Appl. Phys. Lett., 75, 1893 [CrossRef] [Google Scholar]
- Goto, M., Henning, T., Kouchi, A., et al. 2009, ApJ, 693, 610 [NASA ADS] [CrossRef] [Google Scholar]
- He, H., & Thorpe, M. F. 1985, Phys. Rev. Lett., 54, 2107 [CrossRef] [PubMed] [Google Scholar]
- Hiratsuka, M., Nakamori, H., Kogo, Y., et al. 2013, J. Solid Mech. Mater. Eng., 7, 187 [CrossRef] [Google Scholar]
- Huang, P. Y., Kurasch, S., Alden, J. S., et al. 2013, Science, 342, 224 [CrossRef] [Google Scholar]
- Jana, R., Savio, D., Deringer, V. L., & Pastewka, L. 2019, Modell. Simul. Mater. Sci. Eng., 27, 085009 [CrossRef] [Google Scholar]
- Johnson, K. L. 1985, Contact Mechanics (Cambridge: Cambridge University Press) [CrossRef] [Google Scholar]
- Johnson, K. L., Kendall, K., & Roberts, A. D. 1971, Proc. R. Soc. London. Ser. A, 324, 301 [Google Scholar]
- Johnson, D. F., Mullin, J. M., & Mattson, W. D. 2017, J. Phys. Chem. C, 121, 1140 [CrossRef] [Google Scholar]
- Kalweit, M., & Drikakis, D. 2006, Phys. Rev. B, 74, 235415 [NASA ADS] [CrossRef] [Google Scholar]
- Kelires, P. C. 1994, Phys. Rev. Lett., 73, 2460 [CrossRef] [Google Scholar]
- Kern, G., & Hafner, J. 1997, Phys. Rev. B, 56, 4203 [CrossRef] [Google Scholar]
- Kimura, H., Wada, K., Senshu, H., & Kobayashi, H. 2015, ApJ, 812, 67 [NASA ADS] [CrossRef] [Google Scholar]
- Koike, C., Hasegawa, H., & Manabe, A. 1980, Astrophys. Space Sci., 67, 495 [NASA ADS] [CrossRef] [Google Scholar]
- Krijt, S., Güttler, C., Heißelmann, D., Dominik, C., & Tielens, A. G. G. M. 2013, J. Phys. D, 46, 435303 [NASA ADS] [CrossRef] [Google Scholar]
- Lewis, R. S., Anders, E., & Draine, B. T. 1989, Nature, 339, 117 [NASA ADS] [CrossRef] [Google Scholar]
- Li, A., & Draine, B. T. 2001, ApJ, 554, 778 [Google Scholar]
- Li, A., & Greenberg, J. M. 2000, in NATO Science Series II: Mathematics, Physics and Chemistry, Solid state astrochemistry, eds. V. Pirronello, J. Krelowski, & G. Manicò (Dordrecht: Kluwer Academic Publishers), 120, 37 [Google Scholar]
- Li, L., Xu, M., Song, W., et al. 2013a, Appl. Surf. Sci., 286, 287 [CrossRef] [Google Scholar]
- Li, Z., Wang, Y., Kozbial, A., et al. 2013b, Nat. Mater., 12, 925 [CrossRef] [Google Scholar]
- Li, X., Wang, A., & Lee, K.-R. 2018, Comput. Mater. Sci., 151, 246 [CrossRef] [Google Scholar]
- Liew, K. M., He, X. Q., & Wong, C. H. 2004, Acta Mater., 52, 2521 [CrossRef] [Google Scholar]
- Liu, C., Lin, Y., Zhou, Z., & Li, K.-Y. 2017, Carbon, 122, 276 [CrossRef] [Google Scholar]
- Marks, N. A. 2000, Phys. Rev. B, 63, 035401 [CrossRef] [Google Scholar]
- Marks, N. A., Cooper, N. C., McKenzie, D. R., et al. 2002, Phys. Rev. B, 65, 075411 [CrossRef] [Google Scholar]
- Marks, N. A., Lattemann, M., & McKenzie, D. R. 2012, Phys. Rev. Lett., 108, 075503 [CrossRef] [PubMed] [Google Scholar]
- Mathis, J. S., Rumpl, W., & Nordsieck, K. H. 1977, ApJ, 217, 425 [NASA ADS] [CrossRef] [Google Scholar]
- Maugis, D. 2000, Contact, Adhesion and Rupture of Elastic Solids (Berlin: Springer) [CrossRef] [Google Scholar]
- Micelotta, E. R., Jones, A. P., Cami, J., et al. 2012, ApJ, 761, 35 [NASA ADS] [CrossRef] [Google Scholar]
- Millán, E. N., Tramontina, D. R., Urbassek, H. M., & Bringa, E. M. 2016a, Phys. Chem. Chem. Phys., 18, 3423 [CrossRef] [Google Scholar]
- Millán, E. N., Tramontina, D. R., Urbassek, H. M., & Bringa, E. M. 2016b, Phys. Rev. E, 93, 063004 [CrossRef] [Google Scholar]
- Mukai, T., Ishimoto, H., Kozasa, T., Blum, J., & Greenberg, J. M. 1992, A&A, 262, 315 [NASA ADS] [Google Scholar]
- Nietiadi, M. L., Umstätter, P., Alabd Alhafez, I., et al. 2017a, Geophys. Res. Lett., 44, 822 [CrossRef] [Google Scholar]
- Nietiadi, M. L., Umstätter, P., Tjong, T., et al. 2017b, Phys. Chem. Chem. Phys., 19, 16555 [CrossRef] [Google Scholar]
- Nietiadi, M. L., Millán, E. N., Bringa, E. M., & Urbassek, H. M. 2019, Phys. Rev. E, 99, 032904 [CrossRef] [Google Scholar]
- Nietiadi, M. L., Rosandi, Y., & Urbassek, H. M. 2020, Nanoscale Res. Lett., 15, 67 [CrossRef] [Google Scholar]
- Nittler, L. R. 2003, Earth Planet. Sci. Lett., 209, 259 [NASA ADS] [CrossRef] [Google Scholar]
- Nuth, J. A. 1987, Nature, 329, 589 [CrossRef] [Google Scholar]
- Ohnishi, N., Bringa, E. M., Remington, B. A., et al. 2008, J. Phys. Conf. Ser., 112, 042017 [CrossRef] [Google Scholar]
- Okamoto, H., Mukai, T., & Kozasa, T. 1994, Planet. Space Sci., 42, 643 [NASA ADS] [CrossRef] [Google Scholar]
- Oleynik, I. I., Landerville, A. C., Zybin, S. V., Elert, M. L., & White, C. T. 2008, Phys. Rev. B, 78, 180101 [CrossRef] [Google Scholar]
- Ormel, C. W., Paszun, D., Dominik, C., & Tielens, A. G. G. M. 2009, A&A, 502, 845 [NASA ADS] [CrossRef] [EDP Sciences] [Google Scholar]
- Panella, B., Hirscher, M., & Roth, S. 2005, Carbon, 43, 2209 [CrossRef] [Google Scholar]
- Pineau, N. 2013, J. Phys. Chem. C, 117, 12778 [CrossRef] [Google Scholar]
- Pineau, N., Soulard, L., Colombet, L., et al. 2015, J. Appl. Phys., 117, 115902 [CrossRef] [Google Scholar]
- Plimpton, S. 1995, J. Comput. Phys., 117, 1 [Google Scholar]
- Reed, E. J., Maiti, A., & Fried, L. E. 2010, Phys. Rev. E, 81, 016607 [CrossRef] [Google Scholar]
- Schuh, C. A., & Lund, A. C. 2003, Nat. Mater., 2, 449 [CrossRef] [PubMed] [Google Scholar]
- Schwan, J., Ulrich, S., Roth, H., et al. 1996, J. Appl. Phys., 79, 1416 [CrossRef] [Google Scholar]
- Srinivasan, S. G., van Duin, A. C. T., & Ganesh, P. 2015, J. Phys. Chem. A, 119, 571 [CrossRef] [Google Scholar]
- Stukowski, A. 2010, Model. Simul. Mater. Sci. Eng., 18, 015012 [Google Scholar]
- Suk, J. W., Murali, S., An, J., & Ruoff, R. S. 2012, Carbon, 50, 2220 [CrossRef] [Google Scholar]
- Sun, W., Zeng, Q., & Yu, A. 2015, Chem. Eng. Sci., 121, 23 [CrossRef] [Google Scholar]
- Sun, W., Jiang, J., & Chen, P. 2020, Powder Technol., 364, 689 [CrossRef] [Google Scholar]
- Tanaka, H., Wada, K., Suyama, T., & Okuzumi, S. 2012, Prog. Theor. Phys. Suppl., 195, 101 [NASA ADS] [CrossRef] [Google Scholar]
- Tersoff, J. 1988, Phys. Rev. Lett., 61, 2879 [CrossRef] [PubMed] [Google Scholar]
- Thornton, C., & Ning, Z. 1998, Powder Technol., 99, 154 [CrossRef] [Google Scholar]
- Tielens, A. G. G. M. 2005, The Physics and Chemistry of the Interstellar Medium (Cambridge, UK: Cambridge University Press) [CrossRef] [Google Scholar]
- Tielens, A. 2008, ARA&A, 46, 289 [NASA ADS] [CrossRef] [EDP Sciences] [Google Scholar]
- Tielens, A. G. G. M., McKee, C. F., Seab, C. G., & Hollenbach, D. J. 1987, ApJ, 319, L109 [NASA ADS] [CrossRef] [Google Scholar]
- Vis, R. D., Mrowiec, A., Kooyman, P. J., Matsubara, K., & Heymann, D. 2002, Meteorit. Planet. Sci., 37, 1391 [CrossRef] [Google Scholar]
- Wang, Z., & Yin, J. 1998, Chem. Phys. Lett., 289, 189 [CrossRef] [Google Scholar]
- Wickramasinghe, N. C., Wickramasinghe, A. N., & Hoyle, F. 1999, Astrophys. Space Sci., 268, 289 [CrossRef] [Google Scholar]
- Wolf, D. 1990, Surf. Sci., 226, 389 [CrossRef] [Google Scholar]
- Yang, W., Mao, S., Yang, J., et al. 2016, Sci. Rep., 6, 24187 [CrossRef] [Google Scholar]
- Yang, W., Yang, J., Dong, Y., et al. 2018, Carbon, 137, 411 [CrossRef] [Google Scholar]
- Zhang, H., Duan, Z., Zhang, X., et al. 2013, Phys. Chem. Chem. Phys., 15, 11794 [CrossRef] [Google Scholar]
- Zhang, H., Zhou, L., Noonan, O., et al. 2014, Adv. Funct. Mater., 24, 4337 [CrossRef] [Google Scholar]
- Zubko, V. G., Mennella, V., Colangeli, L., & Bussoletti, E. 1996, in The Role of Dust in the Formation of Stars, eds. H. U. Käufl, & R. Siebenmorgen (Berlin: Springer), 333 [CrossRef] [Google Scholar]
All Tables
All Figures
|
Fig. 1 Snapshots showing the (a) initial and (b) final conformation of two R = 20 nm NPs, sp3 = 20% at a velocity of v = 600 m s−1. Atoms are colored according to their original grain affiliation. |
| In the text | |
|
Fig. 2 Snapshots showing a collision of two R = 20 nm NPs, sp3 = 55% at a velocity of v = 600 m s−1, at (a) the start of the simulation, 0 ps, (b) jump to contact, 2 ps, (c) the moment of maximum compression, 8 ps, and during the expansion regime at times of (d) 15 ps, (e) 20 ps, and (f) 40 ps. Atoms are colored according to their original grain affiliation. |
| In the text | |
|
Fig. 3 Time evolution of the (a) overlap, δ, and (b) contact radius, ac, in the collision of two NPs of radius R = 20 nm colliding with velocity v = 600 m s−1. Data are for two sp3 fractions, sp3 = 20 and 55%. |
| In the text | |
|
Fig. 4 Time evolution of the contact radius, ac, in the collision of two NPs of radius R = 20 nm, for an sp3 fraction of (a) sp3 = 20% and (b) sp3 = 55%, colliding with various velocities v. |
| In the text | |
|
Fig. 5 Time evolution of the contact radius, ac, in the collision of two NPs of radius R = 20 nm, colliding with velocity v = 600 m s−1 for sp3 fractions of (a) sp3 = 20% and (b) sp3 = 55%. The simulation results are compared to the estimate of JKR theory, Eq. (2). |
| In the text | |
|
Fig. 6 Dependence of sp3 fraction in the contact region on collision velocity v. Data are for R = 20 nm NPs with (a) various initial sp3 fractions (see legend) and (b) for sp3 = 55%. |
| In the text | |
|
Fig. 7 Graphitic structures generated in the collision zone of two R = 20 nm NPs of sp3 = 55% at velocity v = 800 m s−1. Atoms are colored according to their bonding configuration: green (sp2), blue (sp1). |
| In the text | |
|
Fig. 8 Snapshots showing the final conformation of two R = 20 nm NPs, sp3 = 55%, at the collision velocities indicated. Atoms are colored according to their bonding configuration. |
| In the text | |
|
Fig. 9 Dependence of sp3 fraction in the contact region on collision velocity v for NPs of radius (a) 6.5 nm and (b) 15 nm. |
| In the text | |
|
Fig. 10 Dependence of final sp3 fraction in the contact region on NP radius R for NPs withsp3 = 55% for various collision velocities. |
| In the text | |
|
Fig. 11 Snapshots showing the conformation of two R = 20 nm NPs, sp3 = 20%, at a collision velocity of v = 800 m s−1, immediatelyafter maximum compression. Atoms are colored according to their shear strain. |
| In the text | |
|
Fig. 12 Snapshots of the final configuration of two R = 20 nm NPs of sp3 = 55% colliding with a velocity of v = 3000 m s−1. Cross-sectional view (a) parallel and (b) perpendicular to the collision axis. (c) Perspective view. Atoms are colored according to their shear strain. |
| In the text | |
|
Fig. 13 Graphitic structures generated in the collision of two R = 20 nm NPs of sp3 = 55%. Zoom in on the collision-induced bulge created at a velocity of v = 3000 m s−1. Atoms are colored according to their shear strain. |
| In the text | |
Current usage metrics show cumulative count of Article Views (full-text article views including HTML views, PDF and ePub downloads, according to the available data) and Abstracts Views on Vision4Press platform.
Data correspond to usage on the plateform after 2015. The current usage metrics is available 48-96 hours after online publication and is updated daily on week days.
Initial download of the metrics may take a while.