Fig. 2.
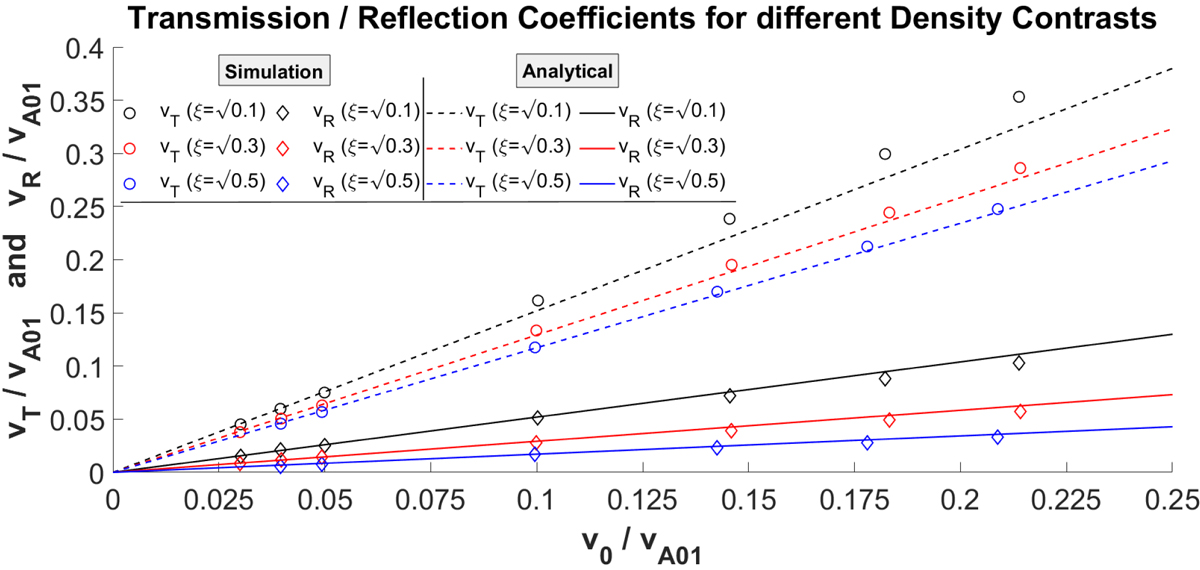
Transmitted (circles) and reflected velocity amplitudes (diamonds) as a function of the incident velocity amplitude (v0) inferred from the linear and nonlinear MHD simulations for different density contrasts. The dashed and solid lines correspond to the predicted analytical results using the transmission and reflection coefficients given by Eqs. (7) and (6).
Current usage metrics show cumulative count of Article Views (full-text article views including HTML views, PDF and ePub downloads, according to the available data) and Abstracts Views on Vision4Press platform.
Data correspond to usage on the plateform after 2015. The current usage metrics is available 48-96 hours after online publication and is updated daily on week days.
Initial download of the metrics may take a while.