Fig. 1.
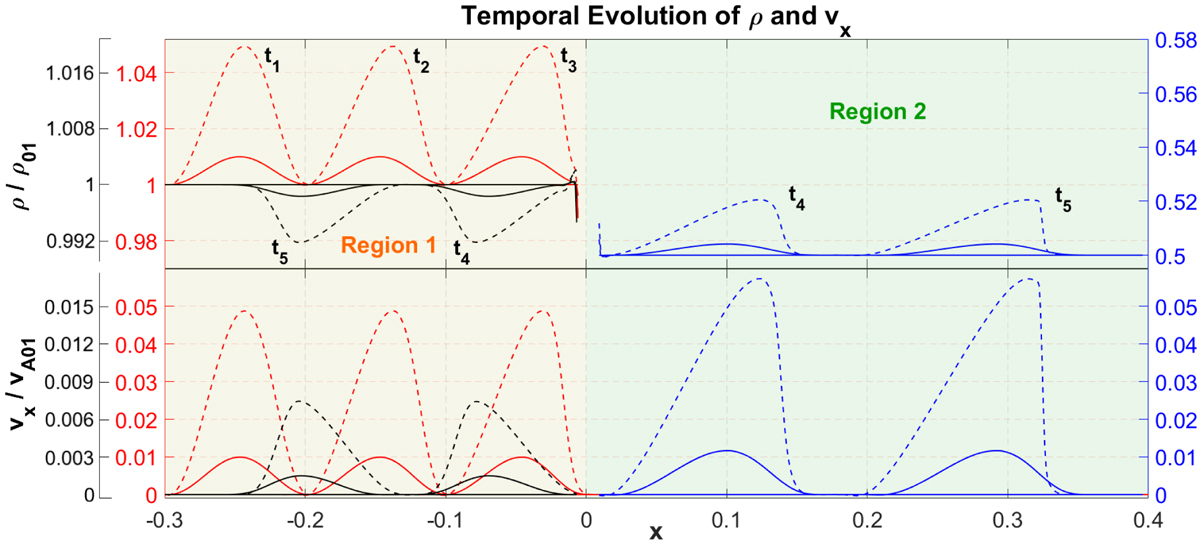
Density (top panel) and velocity (bottom panel) at five different times during the evolution of a linear (solid line) and weakly nonlinear (dashed line) perturbation representing an idealised CW. The incoming wave (red) steepens into a shock in the nonlinear regime. The reflected wave at the interface between region 1 and region 2, which represents the CH boundary (located at x = 0) is a rarefaction wave (black) while the transmitted (blue) is a shock wave.
Current usage metrics show cumulative count of Article Views (full-text article views including HTML views, PDF and ePub downloads, according to the available data) and Abstracts Views on Vision4Press platform.
Data correspond to usage on the plateform after 2015. The current usage metrics is available 48-96 hours after online publication and is updated daily on week days.
Initial download of the metrics may take a while.