Open Access
Fig. 7
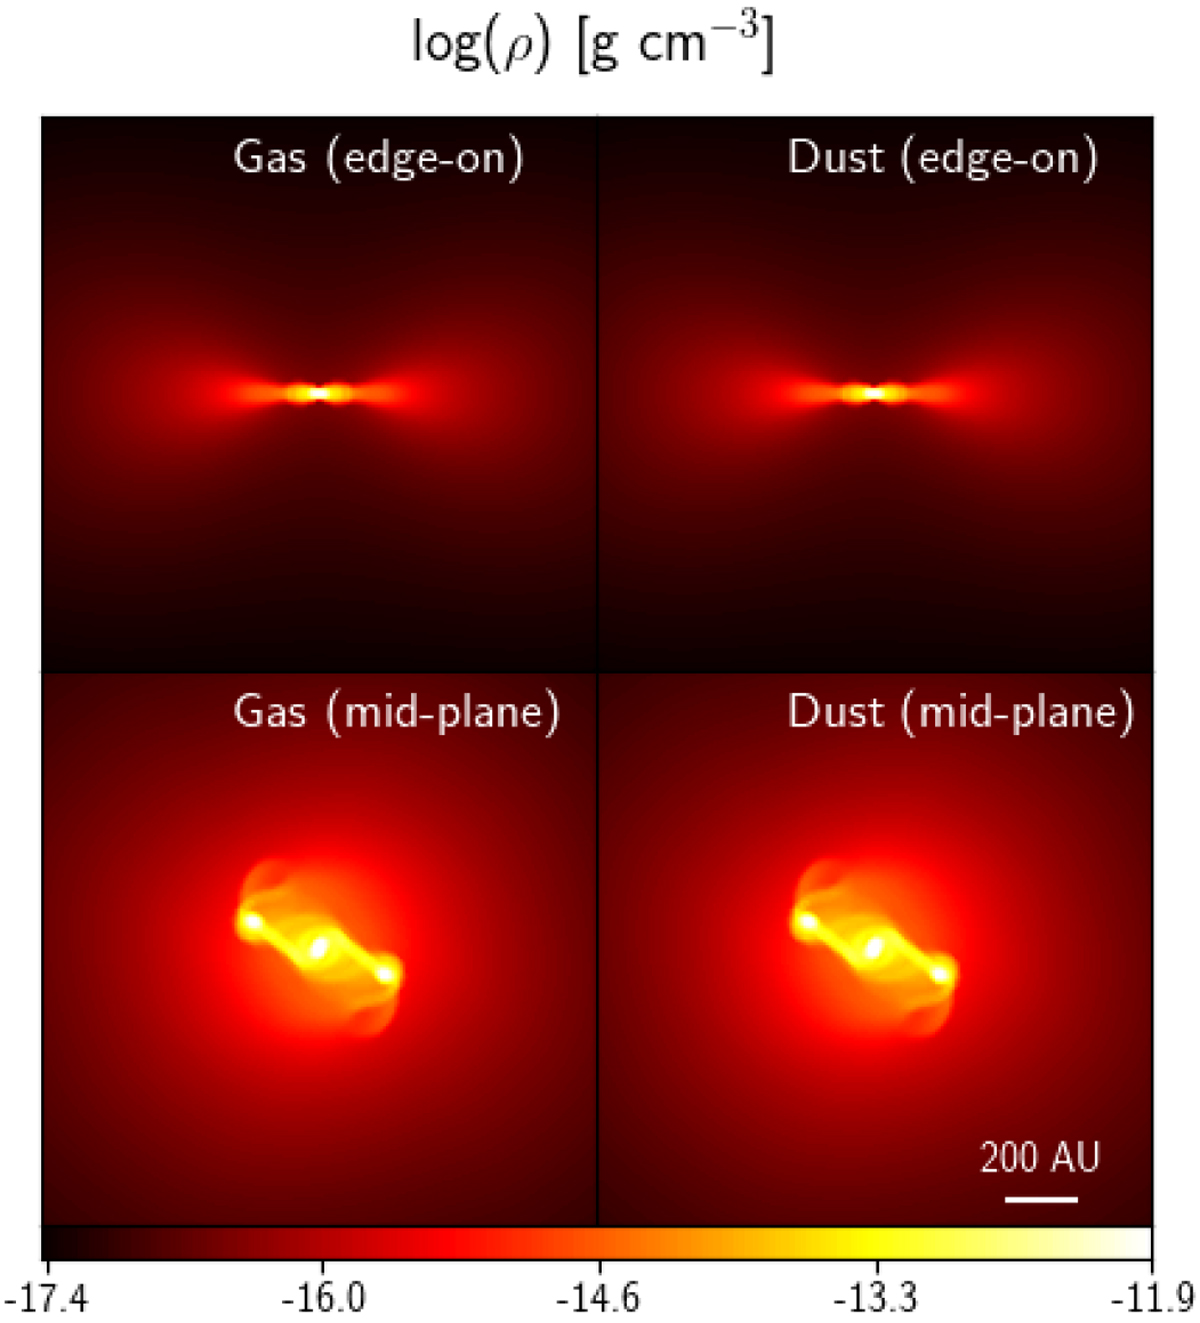
MRN test at tcore + 2 kyr (tcore =73.6 kyr). Edge-on (top) and mid-plane (bottom) cuts of the gas density (left) and dust density of the least coupled species (right). The two maps are almost indistinguishable due to the very strong coupling between gas and all dust species.
Current usage metrics show cumulative count of Article Views (full-text article views including HTML views, PDF and ePub downloads, according to the available data) and Abstracts Views on Vision4Press platform.
Data correspond to usage on the plateform after 2015. The current usage metrics is available 48-96 hours after online publication and is updated daily on week days.
Initial download of the metrics may take a while.