Fig. 4
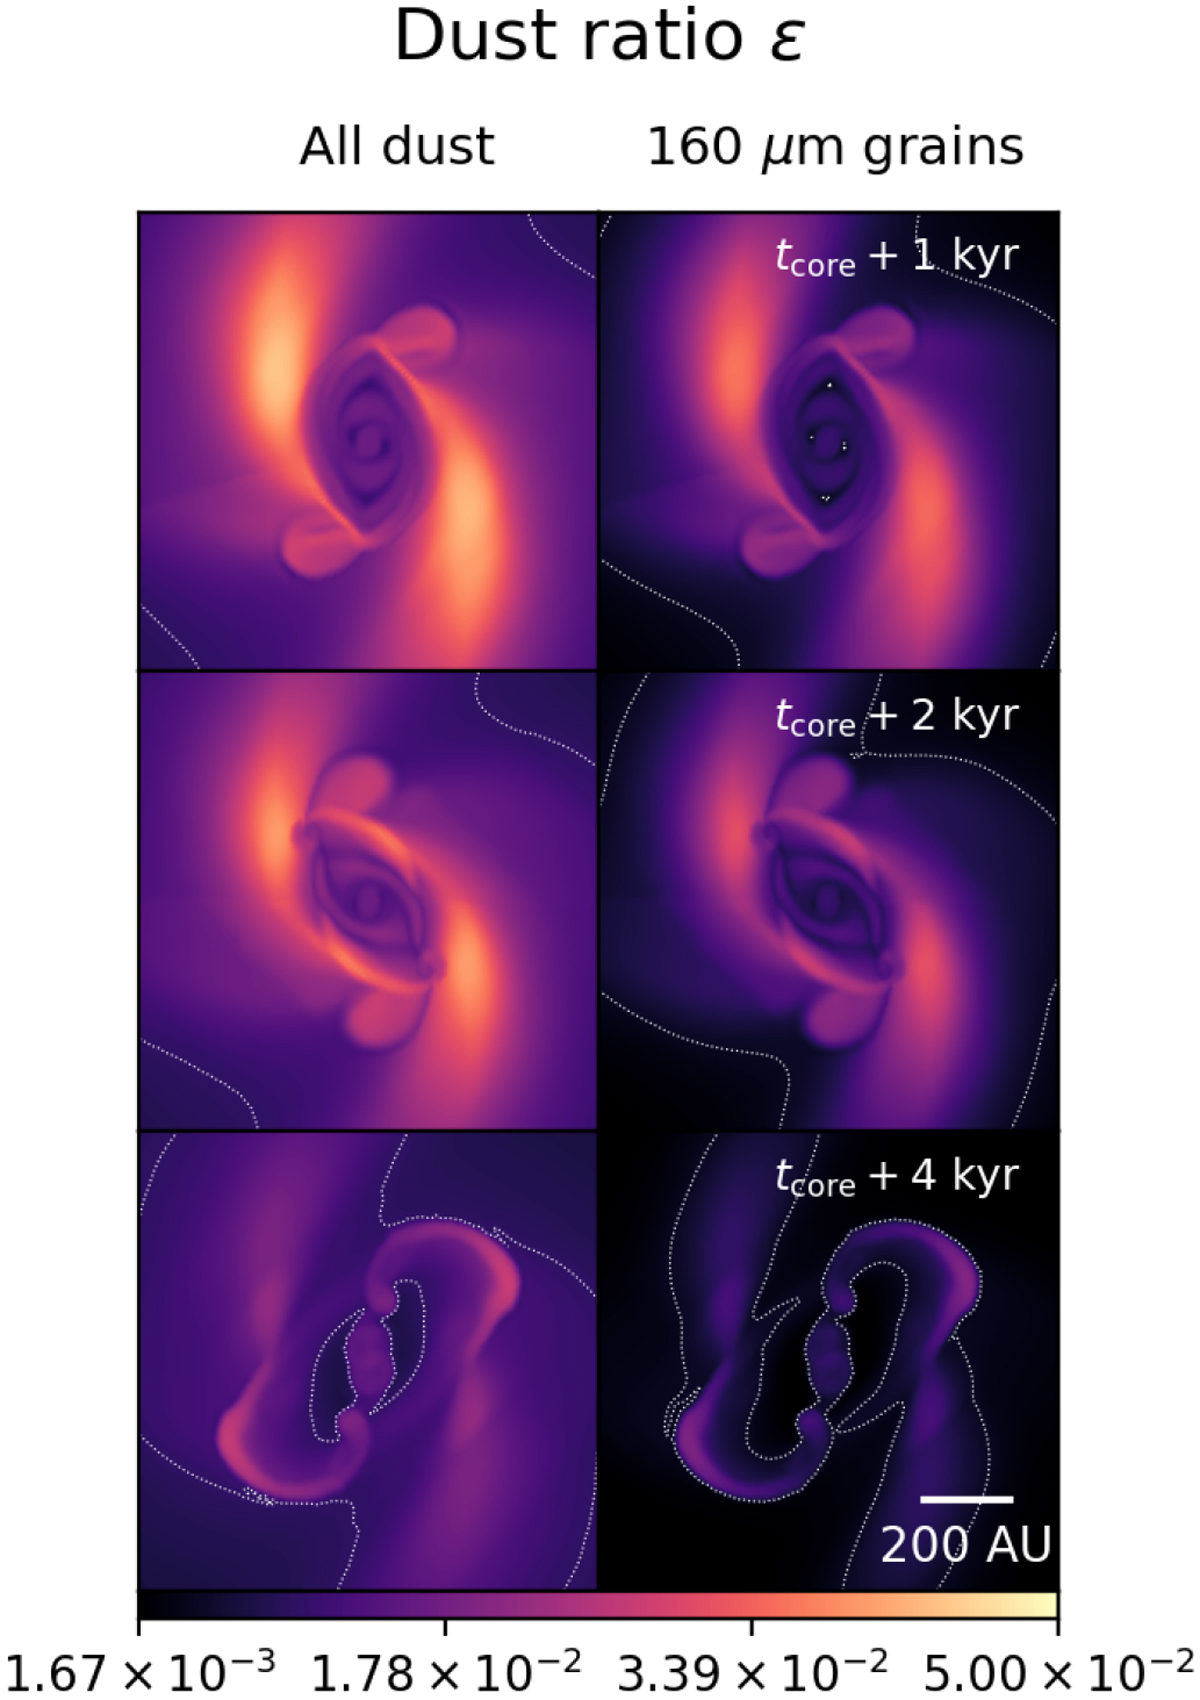
MMMRN test ~ 1 kyr (top), ~2 kyr (middle), and ~4 kyr (bottom) after the first core formation (tcore = 72.84 kyr). Mid-plane view of the total dust ratio (left) and the dust ratio of the least coupled species (right). The colorbar is the same for both figures. The dotted white lines represent the regions where the total (left) or 160 μm grain (right) dust-to-gas ratio is at its initial value, which can also be regarded as a dust enrichment line.
Current usage metrics show cumulative count of Article Views (full-text article views including HTML views, PDF and ePub downloads, according to the available data) and Abstracts Views on Vision4Press platform.
Data correspond to usage on the plateform after 2015. The current usage metrics is available 48-96 hours after online publication and is updated daily on week days.
Initial download of the metrics may take a while.