Fig. 19
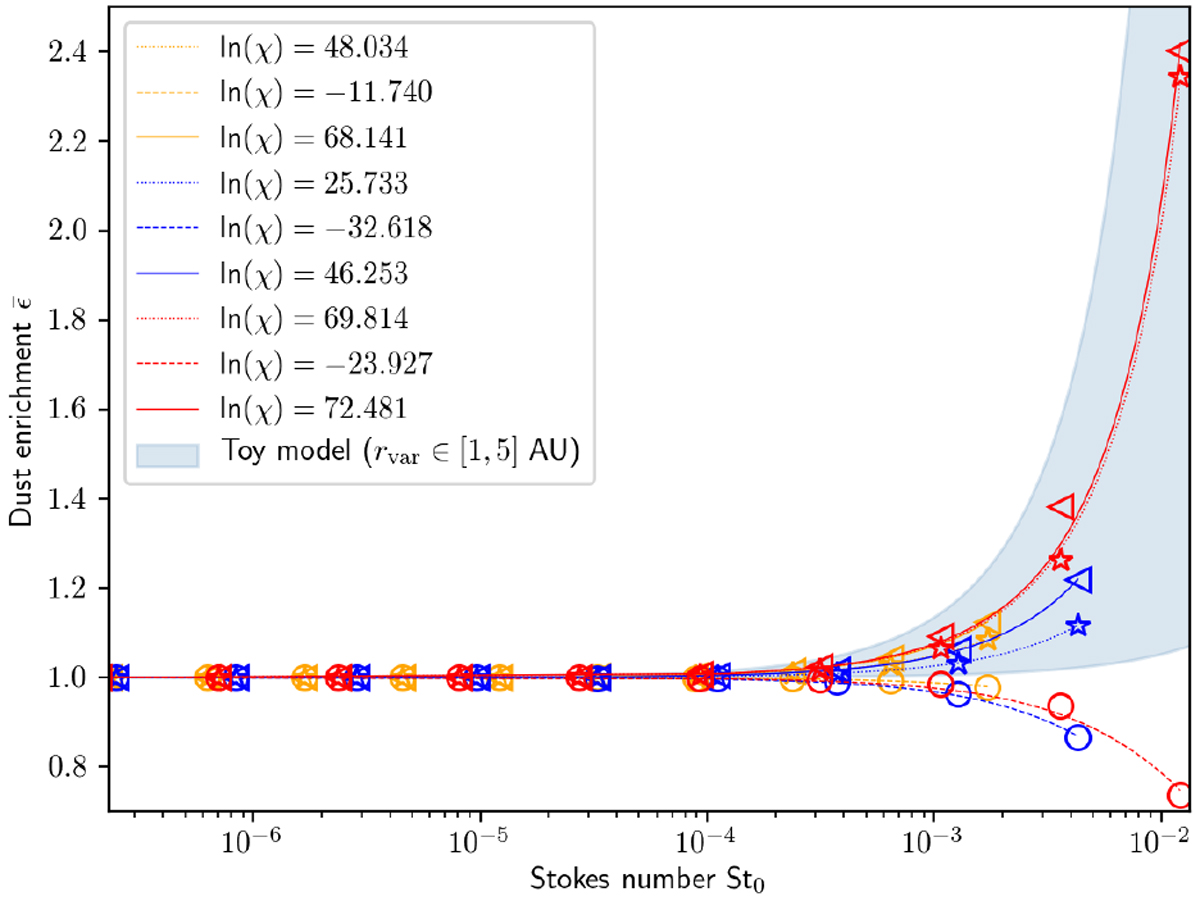
Semi-analytic and measured enrichment in our hydrodynamical models (MRN excluded) against the initial Stokes number. The lines represent the semi-analytical development using a best fit of χ for the FHSC (dotted), disk (solid), and envelope (dashed), respectively. The extreme values of the enrichment given by our toy model are delimited by the blue areas. The color coding and choice of markers is the same as in Fig. 16.
Current usage metrics show cumulative count of Article Views (full-text article views including HTML views, PDF and ePub downloads, according to the available data) and Abstracts Views on Vision4Press platform.
Data correspond to usage on the plateform after 2015. The current usage metrics is available 48-96 hours after online publication and is updated daily on week days.
Initial download of the metrics may take a while.